. 2010 Mar 26;285(13):9667-9682.
doi: 10.1074/jbc.M109.063941. Epub 2010 Jan 25.

Importance of membrane structural integrity for RPE65 retinoid isomerization activity

Affiliations

Importance of membrane structural integrity for RPE65 retinoid isomerization activity

Marcin Golczak et al. J Biol Chem. .

Abstract

Regeneration of visual chromophore in the vertebrate visual cycle involves the retinal pigment epithelium-specific protein RPE65, the key enzyme catalyzing the cleavage and isomerization of all-trans-retinyl fatty acid esters to 11-cis-retinol. Although RPE65 has no predicted membrane spanning domains, this protein predominantly associates with microsomal fractions isolated from bovine retinal pigment epithelium (RPE). We have re-examined the nature of RPE65 interactions with native microsomal membranes by using extraction and phase separation experiments. We observe that hydrophobic interactions are the dominant forces that promote RPE65 association with these membranes. These results are consistent with the crystallographic model of RPE65, which features a large lipophilic surface that surrounds the entrance to the catalytic site of this enzyme and likely interacts with the hydrophobic core of the endoplasmic reticulum membrane. Moreover, we report a critical role for phospholipid membranes in preserving the retinoid isomerization activity and physical properties of RPE65. Isomerase activity measured in bovine RPE was highly sensitive to phospholipase A(2) treatment, but the observed decline in 11-cis-retinol production did not directly reflect inhibition by products of lipid hydrolysis. Instead, a direct correlation between the kinetics of phospholipid hydrolysis and retinoid isomerization suggests that the lipid membrane structure is critical for RPE65 enzymatic activity. We also provide evidence that RPE65 operates in a multiprotein complex with retinol dehydrogenase 5 and retinal G protein-coupled receptor in RPE microsomes. Modifications in the phospholipid environment affecting interactions with these protein components may be responsible for the alterations in retinoid metabolism observed in phospholipid-depleted RPE microsomes. Thus, our results indicate that the enzymatic activity of native RPE65 strongly depends on its membrane binding and phospholipid environment.


Figures

FIGURE 1.
FIGURE 1.
SDS-PAGE analysis of bovine RPE microsomal proteins after incubation with reagents known to solubilize certain classes of membrane proteins. Supernatant (S) and pellet (P) fractions obtained after incubating microsomes with the indicated compounds for 1 h on ice followed by centrifugation at 150,000 × g for 1 h were separated by SDS-PAGE, and the resulting gels were either stained with Coomassie Brilliant Blue (upper panels) or used for immunoblotting with an anti-RPE65 antibody (lower panels). The results clearly show that only C8E4 treatment at concentrations above the CMC resulted in significant extraction of RPE65. The arrowhead indicates the position of RPE65. WB, Western blot.
FIGURE 2.
FIGURE 2.
Effects of pH and buffer concentration on the distribution of RPE65 in microsomal supernatant and pellet fractions. Supernatant (S) and pellet (P) fractions obtained after incubating microsomes with the indicated compounds for 1 h on ice followed by centrifugation at 150,000 × g for 1 h were separated by SDS-PAGE, and the resulting gels were either stained with Coomassie Brilliant Blue (upper panels) or used for immunoblotting with anti-RPE65 and anti-LRAT antibodies (lower panels). A, significant extraction of RPE65 occurred when microsomes were incubated with 50 mm CAPS, pH 11.0, but not at lower pH values. The final concentration of buffers in this experiment was 50 mm. B, RPE65 extraction increased after incubation with higher concentrations of Na2CO3. After incubation in 100 mm Na2CO3, pH 11.5, ∼50% of the RPE65 was extracted from the microsomes. The arrowhead indicates the position of RPE65. WB, Western blot.
FIGURE 3.
FIGURE 3.
Behavior of RPE microsomal alkaline extracts after pH neutralization or dialysis. RPE microsomes were treated with either 100 mm Na2CO3, pH 11.5, or 100 mm CAPS, pH 11.0, for 1 h on ice and then centrifuged for 1 h at 150,000 × g. The supernatant fractions after Na2CO3 and CAPS treatment are shown in lanes 1 and 6, respectively. After adjusting the pH of these extracts to six and incubating them on ice for 1 h, samples were centrifuged at 150,000 × g for 1 h to determine whether RPE65 remained in the supernatant. The supernatant and pellet fractions from this experiment for the pH-adjusted Na2CO3 and CAPS extracts are shown in lanes 2 and 3 and lanes 7 and 8, respectively. Alternatively, we dialyzed the alkaline extracts overnight at 4 °C against PBS containing 1 mm DTT. Afterward, the retentates were collected and centrifuged at 150,000 × g for 1 h to assess the solubility of RPE65 after removal of the extraction agent and adjustment of pH to 7.4. The supernatant and pellet fractions from this experiment with Na2CO3 and CAPS extracts are shown in lanes 4 and 5 and lanes 9 and 10, respectively. In both experiments RPE65 became insoluble upon return to more physiological pH values. The arrowhead indicates the position of RPE65. WB, Western blot.
FIGURE 4.
FIGURE 4.
Partitioning of RPE65 in Anapoe X-114 phase separation experiments. RPE65 microsomes (A) or the 20,000 × g supernatant (B) obtained after centrifugation of homogenized bovine RPE were solubilized in 1% w/v Anapoe X-114 (Anatrace), and mixtures were centrifuged at 150,000 × g for 1 h to sediment insoluble material. Supernatant fractions obtained after centrifugation were used for the phase separation studies performed as described under “Experimental Procedures.” Input indicates total proteins found in the supernatant fractions after high speed centrifugation; aqueous phase indicates proteins remaining in the detergent-poor top phase after phase separation, and detergent rich-phase indicates the proteins found in the small oily droplet at the bottom of the sucrose cushion after phase separation and low speed centrifugation. RPE65 strongly partitioned into the detergent-rich phase in both experiments, demonstrating its amphiphilic nature. The arrowhead indicates the position of RPE65. WB, Western blot.
FIGURE 5.
FIGURE 5.
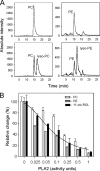
Effects of PLA2 treatment or the products of PLA2 enzymatic activity on retinoid isomerization by bovine RPE microsomes. A, retinoid isomerization reaction was performed in the presence of 0.5 mm CaCl2, and 10 μm of all-trans-retinol was used as the substrate for retinyl ester formation. Increasing amounts of PLA2 were added to the reaction mixture just prior to incubation at 37 °C. Low levels of PLA2 activity markedly inhibited 11-cis-retinol production, whereas higher levels depleted the retinyl ester pool with a concomitant increase in all-trans-retinol production. Error bars were calculated from three independent experiments performed in duplicate. B, addition of PLA2 (0.5 activity units) to an ongoing isomerization reaction rapidly inhibited further production of 11-cis-retinoids. Arrows indicate time points at which PLA2 was added to the assay mixture. Open circles, closed triangles, and open triangles indicate reactions in which PLA2 was added at 0, 5, and 20 min, respectively. Closed circles represent an untreated reaction. The inhibitory effect cannot be explained by competition between LRAT and PLA2 for a common substrate (PC) because retinyl esters were rapidly synthesized at an early stage of this reaction. Thus, the supply of substrate for RPE65 was not affected by PLA2 activity. C, inhibition of 11-cis-retinol formation by PLA2 was Ca2+-dependent. Assays were performed in the presence of 0.5 mm CaCl2 or 1 mm EGTA to chelate residual Ca2+ ions. This experiment indicates that the inhibitory effect of PLA2 is attributable to its calcium-dependent enzymatic activity toward phospholipids. D, excess of lyso-PE, lyso-PC, arachidonic, or palmitic acid (300 μm) was preincubated with RPE microsomes for 5 min at room temperature prior to addition of all-trans-retinol and CRALBP. Levels of 11-cis-retinol produced indicate that the striking effect of PLA2 cannot be totally explained by direct inhibition caused by products of its enzymatic activity because concentrations of lysophospholipids or carboxylic acids corresponding to those in the total membrane digest only modestly slowed the reaction.
FIGURE 6.
FIGURE 6.
Retinoid isomerization is not inhibited by an excess of all-trans-retinol. A, concomitantly with modification of the phospholipid environment upon PLA2 addition, increasing levels of all-trans-retinol were observed. Arrows indicate time points at which 0.5 unit of PLA2 was added to the assays. Open circles and closed inverted triangles correspond to reactions in which PLA2 was added at 5 and 20 min, respectively. Closed circles represent an untreated reaction. The initial precipitous drop in all-trans-retinol was caused by rapid esterification by LRAT. B, dose-dependent effect of all-trans-retinol on formation of the 11-cis isomer reveals that elevated retinoid levels had only a modest influence on the isomerization reaction. Curves in the inset are identical to those in the main figure but placed on a different scale that clearly shows a linear increase in free all-trans-retinol with increasing concentrations of added all-trans-retinol.
FIGURE 7.
FIGURE 7.
Correlation between phospholipid hydrolysis and loss of 11-cis-retinol production. A, liquid chromatography-mass spectrometry analysis of PC and PE content in RPE microsomes before (top panels) and after (bottom panels) treatment with 0.05 unit of PLA2. Panels show extracted ion chromatograms at m/z 760, 782 for PC; 762, 740 for PE; 518, 496 for lyso-PC, and 454, 476 for lyso-PE. These correspond to the most intense peaks found for the named class of phospholipids. Amounts of phospholipids detected in each sample were estimated based on the area below the peaks and compared with standard curves prepared from synthetic standards at their linear dynamic range between 0.1 and 5 μmol. B, quantification of changes in 11-cis-retinol and phospholipid levels after PLA2 treatment. Progressive hydrolysis of PC and PE correlates with gradual loss of RPE65 activity manifested by decreased 11-cis-retinol formation. The trend line follows a decline in 11-cis-retinol production.
FIGURE 8.
FIGURE 8.
Modification of phospholipid environment influences protein-protein interactions in RPE microsomes. A, RPE microsomes were treated with 0.5 unit of PLA2 in BisTris propane buffer, pH 7.4, and 0.5 mm CaCl2 for 20 min at room temperature. After the sample was ultracentrifuged at 130,000 × g for 1 h at 4 °C, proteins in the collected pellet (P) and supernatant (S) fractions were separated by SDS-PAGE and analyzed by both Coomassie staining (left panel) and immunoblotting (right panels). Changes in phospholipid composition resulting from PLA2 treatment led to dissociation of membrane-associated proteins (left panel). The pool of released proteins included the bitopic membrane protein LRAT but not RPE65 (right panels). B, detection of a cross-linked RPE65-containing complex in native RPE microsomes. Asterisks indicate migration of RPE65 and its BMH cross-linked form in 12% acrylamide gels as detected by immunoblot (left panel) and SDS-PAGE (right panel). C, hydrolysis of phospholipids by PLA2 destabilized the RPE65 complex, so it was not trapped by chemical cross-linking (left panel). Formation of an LRAT dimer detected under similar conditions appears to be affected by changes in the phospholipid environment as well (right panel). Asterisks indicate positions of the cross-linked RPE65-containing complex or LRAT dimer.
FIGURE 9.
FIGURE 9.
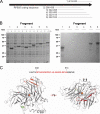
Identification of the epitope-containing RPE65 segment recognized by an RPE65 monoclonal antibody. A, outline of the strategy used to identify the epitope-containing segment. The black arrow represents the RPE65 coding region, and the horizontal lines indicate the region of the protein covered by each fragment. Numbers to the left of each horizontal line indicate the fragment number. B, expression and immunoblotting of the RPE65 fragments. Each of the RPE65 fragments was expressed as a thioredoxin fusion protein in E. coli. SDS-PAGE analysis of bacterial cell lysates with Coomassie stain (left) shows that after a 4-h induction with 1 mm isopropyl 1-thio-β-d-galactopyranoside, each fusion protein was expressed at a high level. Immunoblotting (right) of the bacterial lysates with RPE65 monoclonal antibody showed reactivity only with the fusion proteins containing RPE65 fragments 419–533, 322–514, and 322–533, consistent with the epitope residing within or immediately adjacent to residues 492–514. C, location of the epitope-containing region within the structure of RPE65. The amino acid sequence of the epitope-containing region is shown at the top. Location of the full or partial epitope-containing segment (colored red) within the tertiary structure of RPE65 is shown at the bottom. Orientation of the structure in the left panel is identical to that in Fig. 7. This structure is rotated 120° around the horizontal axis in the right panel. The epitope is found in a region of the protein predicted to face the cytosol and is located far from both the predicted membrane-binding face of the protein and the Cys-231 residue that cross-links with RDH5. This finding explains why the antibody is effective for both immunohistochemical studies and for purification of the RPE65-RDH5 cross-linked complex.
FIGURE 10.
FIGURE 10.
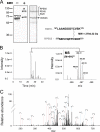
Purification of the BMH-stabilized RPE65-containing complex and identification of its constituent proteins. A, isolation of RPE65 and its complex was achieved on CNBr-activated Sepharose resin coupled to anti-RPE65 monoclonal antibody in the presence of 10 mm CHAPS in PBS. The purity of the preparation was verified by immunoblotting (left panel) and SDS-PAGE (right panel) revealing a highly purified sample. In-gel digest of a band corresponding to cross-linked RPE65 complex reveals the presence of two other lower molecular mass proteins (RDH5 and RGR) (Table 2). B, purified fractions were digested with trypsin, and the peptide composition was analyzed by mass spectrometry. The left panel shows the extracted ion chromatogram at m/z = 466.7 corresponding to a +6 ion (right panel) of intermolecularly cross-linked RPE65 and RDH5. C, amino acid sequence was confirmed based on this MS/MS spectrum of the 2794.3-Da peptide. Mass lines in the spectra that correspond to RPE65 and RDH5 sequences are colored in red and blue, respectively. Some of the most abundant identified ions are labeled with their respective fragment nomenclature.
FIGURE 11.
FIGURE 11.
Packing of RPE65 in the P65 unit cell. The predicted membrane-binding face of RPE65 consisting of residues 196–202, 234–236, and 261–271 (colored orange) faces the largest solvent channel in the crystal. Based on the locations of residues 108 and 127, it is clear that the disordered but potentially amphiphilic segment, consisting of residues 109–126, also faces this channel. This packing arrangement may have been selected to accommodate a protein-detergent mixed micelle in the crystal, as has been noted for other monotopic membrane proteins. The gray box is an outline of a unit cell, and the black symbols indicate crystallographic symmetry elements. This figure was generated using PyMOL (Delano Scientific LLC, Palo Alto, CA) and Protein Data Bank code 3FSN.
FIGURE 12.
FIGURE 12.
RPE65 topology relative to a phosphatidylcholine bilayer. Putative membrane-binding residues are colored red. A palmitoyl group identified by mass spectrometry is modeled on Cys-112. Residues 109–126, which could not be experimentally modeled because of weak electron density, are modeled as an α-helix in this figure as suggested by secondary structure prediction programs. The iron atom marking the RPE65 active site is shown as a brown sphere. Cys-231 identified as a cross-linking site is represented by green and yellow spheres indicating the position of the sulfhydryl group. This figure was generated using PyMOL (Delano Scientific LLC, Palo Alto, CA) and Protein Data bank entry 3FSN.

Similar articles

Cited by

References

    1. Palczewski K. (2006) Annu. Rev. Biochem. 75, 743–767 - PMC - PubMed
    1. Travis G. H., Golczak M., Moise A. R., Palczewski K. (2007) Annu. Rev. Pharmacol. Toxicol. 47, 469–512 - PMC - PubMed
    1. Jin M., Li S., Moghrabi W. N., Sun H., Travis G. H. (2005) Cell 122, 449–459 - PMC - PubMed
    1. Redmond T. M., Poliakov E., Yu S., Tsai J. Y., Lu Z., Gentleman S. (2005) Proc. Natl. Acad. Sci. U.S.A. 102, 13658–13663 - PMC - PubMed
    1. Moiseyev G., Chen Y., Takahashi Y., Wu B. X., Ma J. X. (2005) Proc. Natl. Acad. Sci. U.S.A. 102, 12413–12418 - PMC - PubMed

Publication types

Associated data