. 2010 Feb;135(2):99-114.
doi: 10.1085/jgp.200910345.

Kinetics of PIP2 metabolism and KCNQ2/3 channel regulation studied with a voltage-sensitive phosphatase in living cells

Affiliations

Kinetics of PIP2 metabolism and KCNQ2/3 channel regulation studied with a voltage-sensitive phosphatase in living cells

Björn H Falkenburger et al. J Gen Physiol. 2010 Feb.

Abstract

The signaling phosphoinositide phosphatidylinositol 4,5-bisphosphate (PIP(2)) is synthesized in two steps from phosphatidylinositol by lipid kinases. It then interacts with KCNQ channels and with pleckstrin homology (PH) domains among many other physiological protein targets. We measured and developed a quantitative description of these metabolic and protein interaction steps by perturbing the PIP(2) pool with a voltage-sensitive phosphatase (VSP). VSP can remove the 5-phosphate of PIP(2) with a time constant of tau <300 ms and fully inhibits KCNQ currents in a similar time. PIP(2) was then resynthesized from phosphatidylinositol 4-phosphate (PIP) quickly, tau = 11 s. In contrast, resynthesis of PIP(2) after activation of phospholipase C by muscarinic receptors took approximately 130 s. These kinetic experiments showed that (1) PIP(2) activation of KCNQ channels obeys a cooperative square law, (2) the PIP(2) residence time on channels is <10 ms and the exchange time on PH domains is similarly fast, and (3) the step synthesizing PIP(2) by PIP 5-kinase is fast and limited primarily by a step(s) that replenishes the pool of plasma membrane PI(4)P. We extend the kinetic model for signaling from M(1) muscarinic receptors, presented in our companion paper in this issue (Falkenburger et al. 2010. J. Gen. Physiol. doi:10.1085/jgp.200910344), with this new information on PIP(2) synthesis and KCNQ interaction.


Figures
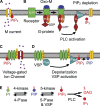
Figure 1.
Figure 1.
M1R signaling and phosphoinositide metabolism. (A) Neuronal M current is mediated by KCNQ2/3 potassium channels (yellow), which require membrane depolarization and PIP2 to open. (B) Binding of the M1R agonist Oxo-M facilitates binding of G proteins to the receptor. This binding induces “activation” of G proteins, i.e., nucleotide exchange at the Gαq subunit from GDP to GTP, and dissociation of Gαq from Gβγ. Gαq-GTP activates PLC, which cleaves PIP2 into DAG and IP3. The absence of PIP2 prevents KCNQ2/3 channels from opening. (C) Voltage-gated ion channels are tetramers. Each subunit consists of a four-segment (S1-S4) voltage sensor domain (green and yellow) and a pore-forming domain (dark red). The S4 segment (yellow) contains positive charges, which move upon depolarization. (D) VSPs are monomers. They contain a four-segment voltage sensor and a phosphatase domain. The phosphatase is activated by depolarization and dephosphorylates PIP2 to PI(4)P. (E) Phosphoinositide metabolism. PI is phosphorylated first by a PI 4-kinase and then by a PIP 5-kinase to yield PI(4,5)P2. A 4-phosphatase and a 5-phosphatase mediate the reverse reactions. VSP is a 5-phosphatase.
Figure 2.
Figure 2.
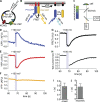
Activation of VSP (Dr-VSP) reduces PH probe FRET. (A) Cells were transfected with PIP2-binding PH probes (PH-PLCδ1) fused to CFP or YFP, Dr-VSP, and KCNQ2 and KCNQ3 channel subunits and recorded in whole cell voltage clamp. (B) Principle of PIP2 measurement by PH probe FRET (see Results and Fig. S3). (C) Photometry setup. Excitation light was scanned from 300 to 500 nm in 200 ms, every 500 ms, and reflected by a dichroic mirror around 440 and 500 nm. Emission light was separated into channels for CFP emission (480/40 nm) and YFP emission (535/30 nm). Time courses (D, E, F, and H) were acquired simultaneously. (D) CFP emission with 440-nm excitation (CFPC). (E) YFP emission with 440-nm excitation, corrected for CFP emission at 535/30 nm and for direct excitation of YFP by 440-nm excitation light (YFPC). (F) YFP emission with 500-nm excitation (YFPY). (G) FRETr = YFPC/CFPC. (H) Tail current amplitude. Membrane was held at −60 mV and depolarized to −20 mV for 300 ms every 500 ms, except for shaded area where membrane was held at +100 mV for 2 s. Tail currents were measured during slow channel deactivation at −60 mV. (I) Time constants of single-exponential fits to FRETr while membrane was held at +100 mV (onset of VSP effect). A summary of 14 cells is shown. (J) Time constant of single-exponential fits to recovery of FRETr after 2 s at +100 mV. A summary of 12 cells is shown.
Figure 3.
Figure 3.
Activation of VSP (Dr-VSP) inhibits KCNQ2/3 current. (A) Currents recorded in cells transfected with KCNQ2/3 alone. (B) Currents in cells transfected with KCNQ2/3 and Dr-VSP. Note the reduction of current at −20 mV after depolarization to +100 mV. (C) Responses in the same cell as in B to a family of stimuli with increasing duration at +100 mV. Magnified time scale as compared with B also shows reduction of current at +100 mV. (D) Summary of normalized outward current at −20 mV (after/before step to +100 mV) for different durations at +100 mV (note log scale of x axis) for 5–12 cells.
Figure 4.
Figure 4.
KCNQ2/3 current behaves like the square of PH probe FRET. (A) In four cells, single exponentials were fitted to simultaneously acquired KCNQ2/3 current and PH probe FRETr during VSP activation (2 s of +100 mV). Measurements from the same cell are connected by a line. (B) In five cells, single exponentials were fitted to simultaneously acquired KCNQ2/3 current and PH probe FRETr during recovery after VSP activation. KCNQ2/3 current was measured as tail current amplitude. (C) VSP effect on KCNQ current with voltage protocol as in Fig. 3 B. Recovery of KCNQ2/3 current at −20 mV was fitted with a double exponential: y = a − b*exp(−c*t) + d*exp(−f*t). (Inset) Summary of time constants from 31 cells. Time constant of the positive term (pos.) is 1/f, and that of the negative term (neg.) is 1/c. (D) Illustration of the consequence of squaring an exponential of the form y = 1 − exp(−t/τ). (E) Plot of KCNQ2/3 current at −20 mV (black) versus PH probe FRETr at the same time during recovery after VSP activation in the cell depicted in Fig. 2. Similar observations were made for three other cells. Red curve corresponds to the equation given. (F) Averaged KCNQ2/3 current at −20 mV versus averaged FRETr at the same time after M1R activation, measured in separate cells (data from Figs. 5 D and 7 B in Jensen et al., 2009). (G) Illustration of the dependence of FRETr (approximated by PH_PIP2; see Fig. S3) and KCNQ current on PIP2 concentration as predicted by the model outlined in Fig. 7 and Tables I and II: Kd of PH probe is 2,000 µm−2 for PIP2 and 0.1 µM for IP3 (0.16 µM IP3); Kd of KCNQ is 2,000 µm−2 for PIP2. KCNQ current = (KCNQ_PIP2)2.
Figure 5.
Figure 5.
PIP 5-kinase overexpression antagonizes VSP effects. (A) Traces from two cells with similar current amplitudes transfected with Dr-VSP and KCNQ2/3 (ctrl., black trace) or with Dr-VSP, KCNQ2/3, and PIP 5-kinase Iγ (+5K, red trace). (B) Dependence of current inhibition on the duration of VSP activation. Baseline-normalized currents at −20 mV immediately after VSP activation are plotted for control (from Fig. 3 D) and +5K (three cells). (C) Time constants of single-exponential fits to current recovery after VSP activation. Summary of 16 cells for control and 4 cells for +5K.
Figure 6.
Figure 6.
PIP 5-kinase is faster than PI 4-kinase. Tail current amplitudes were used to measure current inhibition by Dr-VSP or M1R activation and its recovery. (A) Time course of tail current amplitude in a cell transfected with Dr-VSP and KCNQ2/3 (2 points s−1). (B) Superimposed currents at time points before VSP activation (a), after VSP activation (b), and during recovery (c). (C) Summary of tail current amplitudes relative to baseline after VSP activation (b/a) and after recovery (c/a). (D) Time constant of a single-exponential fit to the recovery time course (time b to c). (C and D) Summaries of 19 cells. (E) Time course of tail current amplitudes in a cell transfected with M1R and KCNQ2/3 (1 point s−1). (F) Superimposed currents at time points a, b, and c indicated in E. (G) Tail current inhibition by M1R activation (summary of 10 cells). (H) Time constant of an exponential fit of recovery (summary of seven cells).
Figure 7.
Figure 7.
Schematic of the kinetic model. Model species are denoted by Roman letters, and reactions are in italics. Initial conditions and rate constants are listed in Tables I and II, and differential equations are in Table S1. For PIP2 and IP3 binding to KCNQ and PH, the association reactions are referred to as forward reactions, and dissociation reactions are referred to as reverse reactions. KCNQ2/3 current depends on the square of PIP2-bound KCNQ2/3 subunits (PIP2_KCNQ2/3).
Figure 8.
Figure 8.
Modeling related to PIP 5-kinase and VSP. Traces are model predictions, and symbols are data. (A) Model current during VSP activation superimposed with the time course of current inhibition from Fig. 3 D. (B) Model current recovery superimposed with averaged time courses as in Fig. 6 A (n = 11 cells). (C) Model predictions for PI(4)P and PIP2 during VSP activation and recovery.
Figure 9.
Figure 9.
Modeling of PIP2 depletion by M1R activation. Symbols are data from Jensen et al. (2009), and lines are model predictions. (A–C) KCNQ2/3 current. (D–F) PH probe FRET. (A and D) Time course of current/FRET inhibition by 10 µM Oxo-M. (B and E) Time course of recovery after M1R activation. (C and F) Concentration–response curves. Parameters for the red, solid curves are as listed in Tables I and II. For the blue, dotted curves, PI kinases and phosphatases were sped up by 10-fold (k_4K, 2.6 × 10⁻³ s−1; k_4P, 0.08 s−1; k_5K, 0.2 s−1; k_5P, 0.14 s−1). For the green, dashed curves, the PI 4-kinase was sped up during Oxo-M (but not during recovery) in a manner depending on Oxo-M concentration (2.6 × 10⁻⁴ s−1 for 0.001 µM, 5 × 10⁻⁴ s−1 for 0.01 µM, and 2.6 × 10⁻³ s−1 for 0.1 µM and above). k_5K was 0.2 s−1 during Oxo-M and 0.02 s−1 during recovery. k_4P and k_5P were not accelerated. k_PLC was 0.2 µm2 s−1 to fit onset. PLConPIP was 0.

Similar articles

Cited by

References

    1. Akemann W., Lundby A., Mutoh H., Knöpfel T. 2009. Effect of voltage sensitive fluorescent proteins on neuronal excitability. Biophys. J. 96:3959–3976 10.1016/j.bpj.2009.02.046 - DOI - PMC - PubMed
    1. Balla T. 2007. Imaging and manipulating phosphoinositides in living cells. J. Physiol. 582:927–937 10.1113/jphysiol.2007.132795 - DOI - PMC - PubMed
    1. Balla A., Tuymetova G., Tsiomenko A., Várnai P., Balla T. 2005. A plasma membrane pool of phosphatidylinositol 4-phosphate is generated by phosphatidylinositol 4-kinase type-III alpha: studies with the PH domains of the oxysterol binding protein and FAPP1. Mol. Biol. Cell. 16:1282–1295 10.1091/mbc.E04-07-0578 - DOI - PMC - PubMed
    1. Brown S.A., Morgan F., Watras J., Loew L.M. 2008. Analysis of phosphatidylinositol-4,5-bisphosphate signaling in cerebellar Purkinje spines. Biophys. J. 95:1795–1812 - PMC - PubMed
    1. Chong L.D., Traynor-Kaplan A., Bokoch G.M., Schwartz M.A. 1994. The small GTP-binding protein Rho regulates a phosphatidylinositol 4-phosphate 5-kinase in mammalian cells. Cell. 79:507–513 10.1016/0092-8674(94)90259-3 - DOI - PubMed

Publication types

MeSH terms

Substances