. 2010 Feb;135(2):135-47.
doi: 10.1085/jgp.200910334.

Immunomodulation of voltage-dependent K+ channels in macrophages: molecular and biophysical consequences

Affiliations

Immunomodulation of voltage-dependent K+ channels in macrophages: molecular and biophysical consequences

Núria Villalonga et al. J Gen Physiol. 2010 Feb.

Abstract

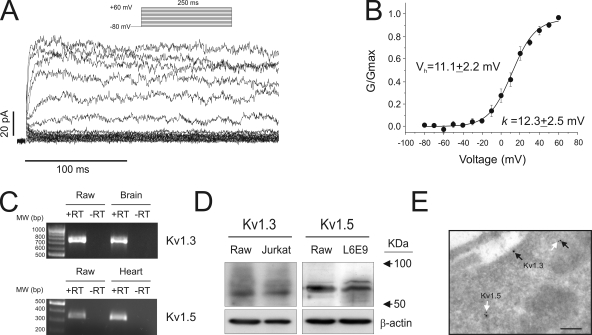
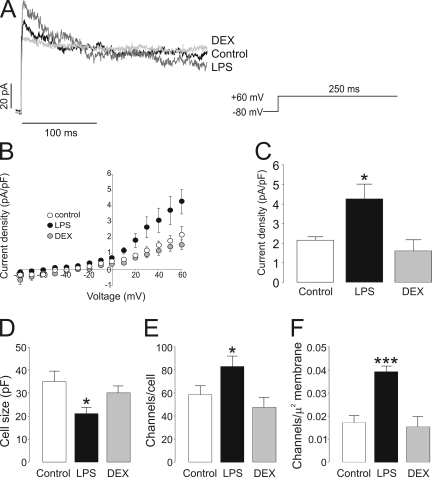
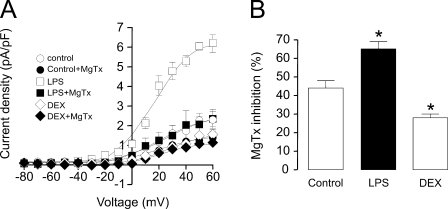
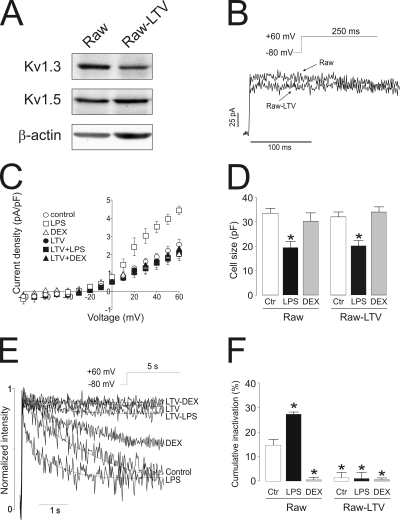
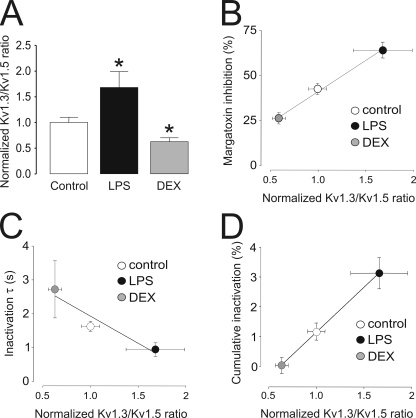
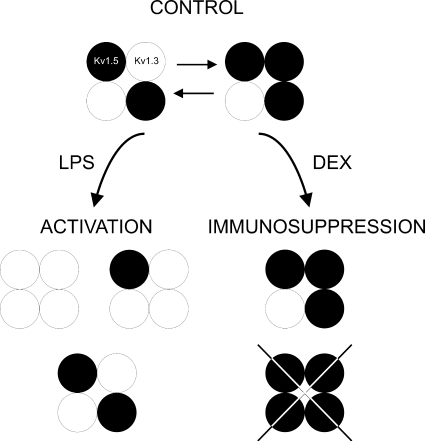
Voltage-dependent potassium (K(v)) channels play a pivotal role in the modulation of macrophage physiology. Macrophages are professional antigen-presenting cells and produce inflammatory and immunoactive substances that modulate the immune response. Blockage of K(v) channels by specific antagonists decreases macrophage cytokine production and inhibits proliferation. Numerous pharmacological agents exert their effects on specific target cells by modifying the activity of their plasma membrane ion channels. Investigation of the mechanisms involved in the regulation of potassium ion conduction is, therefore, essential to the understanding of potassium channel functions in the immune response to infection and inflammation. Here, we demonstrate that the biophysical properties of voltage-dependent K(+) currents are modified upon activation or immunosuppression in macrophages. This regulation is in accordance with changes in the molecular characteristics of the heterotetrameric K(v)1.3/K(v)1.5 channels, which generate the main K(v) in macrophages. An increase in K(+) current amplitude in lipopolysaccharide-activated macrophages is characterized by a faster C-type inactivation, a greater percentage of cumulative inactivation, and a more effective margatoxin (MgTx) inhibition than control cells. These biophysical parameters are related to an increase in K(v)1.3 subunits in the K(v)1.3/K(v)1.5 hybrid channel. In contrast, dexamethasone decreased the C-type inactivation, the cumulative inactivation, and the sensitivity to MgTx concomitantly with a decrease in K(v)1.3 expression. Neither of these treatments apparently altered the expression of K(v)1.5. Our results demonstrate that the immunomodulation of macrophages triggers molecular and biophysical consequences in K(v)1.3/K(v)1.5 hybrid channels by altering the subunit stoichiometry.


Figures

Figure 1.
Figure 1.
Macrophages express Kv1.3 and Kv1.5. Cells were held at −80 mV, and pulse potentials were applied as indicated. (A) Representative traces of delayed rectifier K+ currents. (B) Steady-state activation curve of the outward current. Conductance was plotted against test potentials. (C) mRNA expression of Kv1.3 and Kv1.5 in Raw 264.7 cells. Mouse brain and heart RNA were used as positive controls for Kv1.3 and Kv1.5, respectively. PCR reactions were performed in the presence (+) or absence (−) of the retrotranscriptase reaction. (D) Kv1.3 and Kv1.5 protein expression in Raw macrophages. Jurkat T lymphocytes and L6E9 skeletal muscle myoblasts were used as positive controls for Kv1.3 and Kv1.5, respectively. (E) Immunocytochemical electron microscopic detection of Kv1.3 and Kv1.5 proteins. Arrows show specific channel protein localization. Black arrow, Kv1.3; white arrow, Kv1.5; bar, 0.20 µm.
Figure 2.
Figure 2.
Voltage-dependent K+ currents in Raw 264.7 macrophages. (A) Representative traces of delayed rectifier K+ currents in control, LPS-, and DEX-treated cells. Macrophages were treated with 100 ng/ml LPS and 1 µM DEX for 24 h. Cells were held at −80 mV, and currents were elicited by a depolarizing pulse to +60 mV (250-ms duration). Black trace, control; dark gray trace, LPS; light gray trace, DEX. (B) Current density (pA/pF) versus voltage relationship of K+ currents. Current density was calculated as a function of peak amplitude and the cell capacitance of each recorded cell. (C) Peak current density at +60 mV. (D) Cell capacitance (pF) from the same cell population from B. (E) Channel density was calculated from the conductance of Kv1.3 (13 pS) and Kv1.5 (8 pS) following the real-time PCR results in Fig. 4 and the Kv1.3/ Kv1.5 ratio shown in Fig. 8. (F) The results in E as a function of the plasma cell membrane surface. White (bar or circle), control; black (bar or circle), LPS; gray (bar or circle), DEX. *, P < 0.05; ***, P < 0.001 versus control; n > 10 cells per group (Student’s t test).
Figure 3.
Figure 3.
MgTx inhibits K+ currents in macrophages. Cells were held at −80 mV, and pulse potentials were applied as indicated in Fig. 1 in the presence or absence of 750 pM MgTx. (A) Current density (pA/pF) versus voltage relationship of K+ currents. Current density was calculated as a function of the peak amplitude and the capacitance for each recorded cell in the presence (black symbols) and absence (white symbols) of MgTx. (B) Percentage of MgTx inhibition at the peak current density (+60 mV). White bar, control; black bar, LPS; gray bar, DEX. *, P < 0.05 versus control; n = 4–6 cells per group (Student’s t test).
Figure 4.
Figure 4.
Activation and immunosuppression differentially regulates Kv1.3 and Kv1.5 in macrophages. Control cells were incubated for 24 h in the presence of LPS and DEX. Samples were collected after the addition of agents, and Kv1.3 and Kv1.5 expression was analyzed. (A) Kv1.3 (white bar) and Kv1.5 (black bar) relative mRNA expression by real-time PCR. Values are the mean ± SEM (n = 4). Significant differences were only found with Kv1.3 (*, P < 0.05; **, P < 0.01 vs. control; Student’s t test). Using standard curves, fold variation in arbitrary units (A.U.) was normalized to 18S relative quantity (RQ) as follows: (Kv1.5 or Kv1.3 RQ (LPS or DEX)/18S RQ (LPS or DEX))/(Kv1.5 or Kv1.3 RQ (control)/18S RQ (control)). (B) Kv1.3, Kv1.5, and iNOS protein expression in macrophages. Representative blots are shown. (C and D) Kv1.3 (C) and Kv1.5 (D) quantification of data in B. Values were normalized to β actin. In all cases, arbitrary units are standardized to the control value in the absence of treatment. White bars, control; black bars, LPS; gray bars, DEX. Values are the mean ± SEM of at least three independent experiments. *, P < 0.05; **, P < 0.01 versus control (Student’s t test).
Figure 5.
Figure 5.
Biophysical properties of the C-type inactivation of K+ currents in Raw macrophages. (A) Representative traces of C-type inactivation. Cells were held at −80 mV, and pulse potentials were applied from −80 to +60 mV for 5 s. For comparison, the intensity in each group has been normalized. (B) Time constant of inactivation (τ). Values are the mean ± SEM of at least 10 independent cells. *, P < 0.05 versus control (Student’s t test).
Figure 6.
Figure 6.
Biophysical properties of the cumulative inactivation of K+ currents in Raw macrophages. (A–C) Representative traces showing cumulative inactivation of K+ currents. Cells were held at −80 mV, and currents were elicited by a train of eight depolarizing voltage steps (200-ms duration) to +60 mV once every 400 ms. (A) Control. (B) LPS. (C) DEX. (D) Percentage of cumulative inactivation at the peak current. The percentage was calculated as a result of the difference between the peak current at the first pulse and the remaining current at the last. (E) Plot of normalized current area versus pulse. The current amplitude became progressively smaller from the first trace to the last in control and LPS, but not in DEX-treated macrophages. Inset represents K+ current area decay from control and DEX-treated macrophages for magnification. Values are the mean ± SEM of at least 10 independent cells. **, P < 0.01 versus control (Student’s t test).
Figure 7.
Figure 7.
Kv1.3 gene silencing abolishes LPS- and DEX-dependent biophysical changes in macrophages. LTV shRNA (mouse) Kv1.3 was used to silence the Kv1.3 gene in Raw 264.7 macrophages. (A) A representative Western blot. Note that although Kv1.3 expression is lower in LTV, relative Kv1.5 abundance was similar in both groups. Raw, control macrophages; Raw-LTV, LTV-silenced Kv1.3 macrophages. (B) Representative traces of K+ currents in macrophages. Cells were held at −80 mV, and currents were elicited by a depolarizing pulse to +60 mV (250-ms duration). (C) Current density (pA/pF) versus voltage relationship of K+ currents. Current density was calculated as a function of peak amplitude and the capacitance of each recorded cell in the presence or absence of LPS and DEX. (D) Cell capacitance (pF) from the same cell population from B. (E) Representative traces of C-type inactivation. Cells were held at −80 mV, and pulse potentials were applied from −80 to +60 mV for 5 s. For comparison, the intensity in each group has been normalized. (F) Percentage of cumulative inactivation at the peak current. Cells were held at −80 mV, and currents were elicited by a train of eight depolarizing voltage steps (200-ms duration) to +60 mV once every 400 ms. The percentage was calculated as a result of the difference between the peak current at the first pulse and the remaining current at the last. (D and F) Raw, no infected Raw macrophages; Raw-LTV, lentivirus-infected Raw cells; white bars, control (no treatment); black bars, LPS; gray bars, DEX. Values are the mean ± SEM of six to eight independent cells. *, P < 0.001 versus control (Student’s t test).
Figure 8.
Figure 8.
Variations in the Kv1.3/Kv1.5 ratio correlate with changes in biophysical properties of K+ currents in macrophages. (A) Kv1.3/Kv1.5 ratios in Raw cells cultured in the presence or absence of LPS and DEX were calculated from real-time PCR experiments in Fig. 4 and standardized to the value of control cells. Values are the mean ± SEM of at least three independent experiments. *, P < 0.05 versus control (Student’s t test). (B) Percentage of MgTx inhibition plotted against the Kv1.3/Kv1.5 ratio. (C) Time constant of inactivation from Fig. 4 (τ) plotted against the Kv1.3/Kv1.5 ratio. (D) Percentage of cumulative inactivation plotted against the Kv1.3/Kv1.5 ratio. The Pearson product-moment correlation coefficient using a two-tailed p-value was calculated (P < 0.0393, P < 0.0355, and P < 0.0116 for A, B, and C, respectively). White (bar or circle), control; black (bar or circle), LPS; gray (bar or circle), DEX.
Figure 9.
Figure 9.
Diagram of major heterotetrameric structures in Raw macrophages upon immunomodulation. Raw cells express Kv1.3 and Kv1.5. Because MgTx abolished Kv currents, Kv1.5 does not form homomeric complexes. However, molecular, pharmacological, and biophysical data indicate that Raw cells express more Kv1.5 than Kv1.3. LPS-induced macrophages increased the number of Kv1.3 subunits at the complex. However, the immunosuppressant DEX decreases Kv1.3, which generates Kv1.5-predominant heteromeric channels. Different Kv1.3/Kv1.5 molecular ratios are responsible for the biophysical properties that lead to functional consequences during activation and immunosuppression. White circles, Kv1.3; black circles, Kv1.5.

Similar articles

Cited by

References

    1. Arias C., Guizy M., David M., Marzian S., González T., Decher N., Valenzuela C. 2007. Kvbeta1.3 reduces the degree of stereoselective bupivacaine block of Kv1.5 channels. Anesthesiology. 107:641–651 10.1097/01.anes.0000282100.32923.5c - DOI - PubMed
    1. Attardi B., Takimoto K., Gealy R., Severns C., Levitan E.S. 1993. Glucocorticoid induced up-regulation of a pituitary K+ channel mRNA in vitro and in vivo. Receptors Channels. 1:287–293 - PubMed
    1. Ben Y., Chen J., Zhu R., Gao L., Bai C. 2008. Upregulation of AQP3 and AQP5 induced by dexamethasone and ambroxol in A549 cells. Respir. Physiol. Neurobiol. 161:111–118 10.1016/j.resp.2007.12.007 - DOI - PubMed
    1. Cahalan M.D., Chandy K.G. 1997. Ion channels in the immune system as targets for immunosuppression. Curr. Opin. Biotechnol. 8:749–756 10.1016/S0958-1669(97)80130-9 - DOI - PubMed
    1. Eder C. 1998. Ion channels in microglia (brain macrophages). Am. J. Physiol. 275:C327–C342 - PubMed

Publication types