

Hierarchical organization of human auditory cortex: evidence from acoustic invariance in the response to intelligible speech
- PMID: 20100898
- PMCID: PMC2936804
- DOI: 10.1093/cercor/bhp318
Hierarchical organization of human auditory cortex: evidence from acoustic invariance in the response to intelligible speech
Abstract
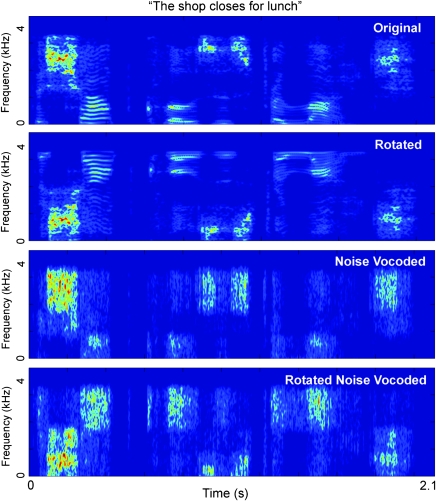
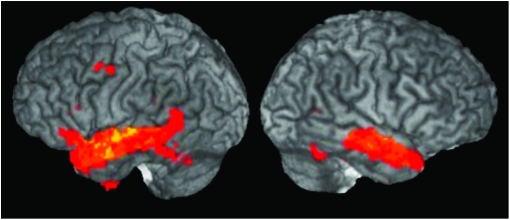
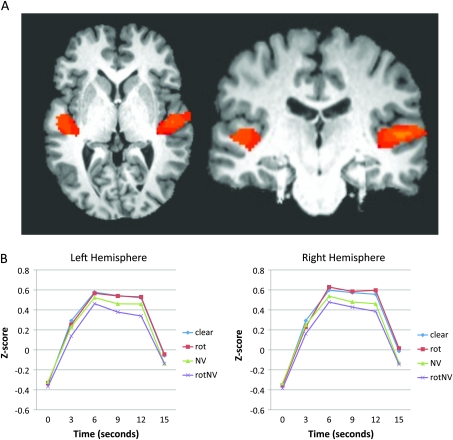
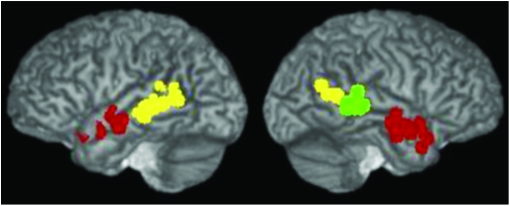
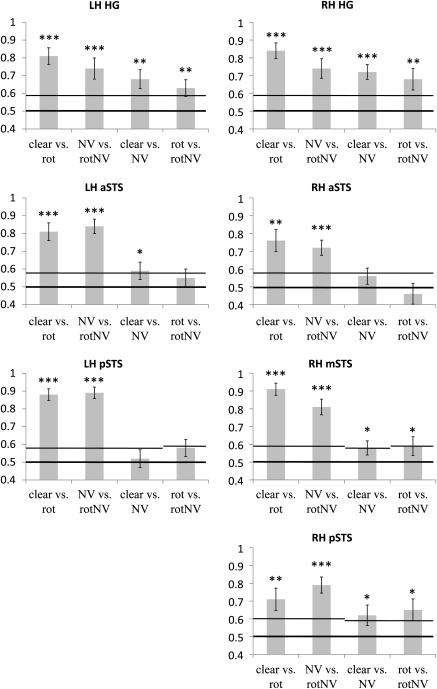
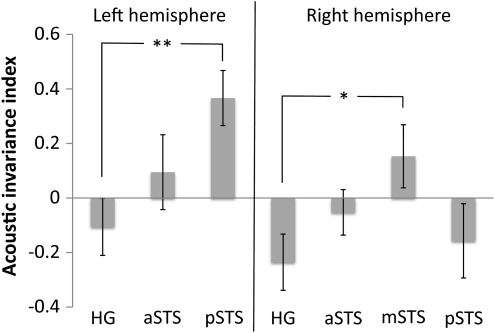
Hierarchical organization of human auditory cortex has been inferred from functional imaging observations that core regions respond to simple stimuli (tones) whereas downstream regions are selectively responsive to more complex stimuli (band-pass noise, speech). It is assumed that core regions code low-level features, which are combined at higher levels in the auditory system to yield more abstract neural codes. However, this hypothesis has not been critically evaluated in the auditory domain. We assessed sensitivity to acoustic variation within intelligible versus unintelligible speech using functional magnetic resonance imaging and a multivariate pattern analysis. Core auditory regions on the dorsal plane of the superior temporal gyrus exhibited high levels of sensitivity to acoustic features, whereas downstream auditory regions in both anterior superior temporal sulcus and posterior superior temporal sulcus (pSTS) bilaterally showed greater sensitivity to whether speech was intelligible or not and less sensitivity to acoustic variation (acoustic invariance). Acoustic invariance was most pronounced in more pSTS regions of both hemispheres, which we argue support phonological level representations. This finding provides direct evidence for a hierarchical organization of human auditory cortex and clarifies the cortical pathways supporting the processing of intelligible speech.
Figures
Similar articles
-
Cortical dynamics of acoustic and phonological processing in speech perception.PLoS One. 2011;6(6):e20963. doi: 10.1371/journal.pone.0020963. Epub 2011 Jun 13. PLoS One. 2011. PMID: 21695133 Free PMC article.
-
Segmental processing in the human auditory dorsal stream.Brain Res. 2008 Jul 18;1220:179-90. doi: 10.1016/j.brainres.2007.11.013. Epub 2007 Nov 17. Brain Res. 2008. PMID: 18096139 Review.
-
Transient and sustained cortical activity elicited by connected speech of varying intelligibility.BMC Neurosci. 2012 Dec 31;13:157. doi: 10.1186/1471-2202-13-157. BMC Neurosci. 2012. PMID: 23276297 Free PMC article.
-
Neural Tuning to Low-Level Features of Speech throughout the Perisylvian Cortex.J Neurosci. 2017 Aug 16;37(33):7906-7920. doi: 10.1523/JNEUROSCI.0238-17.2017. Epub 2017 Jul 17. J Neurosci. 2017. PMID: 28716965 Free PMC article.
-
[Auditory perception and language: functional imaging of speech sensitive auditory cortex].Rev Neurol (Paris). 2001 Sep;157(8-9 Pt 1):837-46. Rev Neurol (Paris). 2001. PMID: 11677406 Review. French.
Cited by
-
A temporal bottleneck in the language comprehension network.J Neurosci. 2012 Jun 27;32(26):9089-102. doi: 10.1523/JNEUROSCI.5685-11.2012. J Neurosci. 2012. PMID: 22745508 Free PMC article.
-
Discerning the functional networks behind processing of music and speech through human vocalizations.PLoS One. 2019 Oct 10;14(10):e0222796. doi: 10.1371/journal.pone.0222796. eCollection 2019. PLoS One. 2019. PMID: 31600231 Free PMC article.
-
Dissociation between the activity of the right middle frontal gyrus and the middle temporal gyrus in processing semantic priming.PLoS One. 2011;6(8):e22368. doi: 10.1371/journal.pone.0022368. Epub 2011 Aug 4. PLoS One. 2011. PMID: 21829619 Free PMC article.
-
The neural processing of foreign-accented speech and its relationship to listener bias.Front Hum Neurosci. 2014 Oct 8;8:768. doi: 10.3389/fnhum.2014.00768. eCollection 2014. Front Hum Neurosci. 2014. PMID: 25339883 Free PMC article.
-
The pathways for intelligible speech: multivariate and univariate perspectives.Cereb Cortex. 2014 Sep;24(9):2350-61. doi: 10.1093/cercor/bht083. Epub 2013 Apr 12. Cereb Cortex. 2014. PMID: 23585519 Free PMC article.
References
-
- Bates E, Wilson SM, Saygin AP, Dick F, Sereno MI, Knight RT, Dronkers NF. Voxel-based lesion-symptom mapping. Nat Neurosci. 2003;6:448–450. - PubMed
-
- Bench J, Kowal A, Bamford J. The BKB (Bamford-Kowal-Bench) sentence lists for partially-hearing children. Br J Audiol. 1979;13:108–112. - PubMed
-
- Binder JR, Frost JA, Hammeke TA, Bellgowan PS, Springer JA, Kaufman JN, Possing ET. Human temporal lobe activation by speech and nonspeech sounds. Cereb Cortex. 2000;10:512–528. - PubMed
-
- Blesser B. Speech perception under conditions of spectral transformation. I. Phonetic characteristics. J Speech Hear Res. 1972;15:5–41. - PubMed
Publication types
MeSH terms
Substances
Grants and funding
LinkOut - more resources
Full Text Sources
Molecular Biology Databases
