. 2010 Mar;42(3):224-8.
doi: 10.1038/ng.522. Epub 2010 Jan 24.

A genome-wide association study identifies pancreatic cancer susceptibility loci on chromosomes 13q22.1, 1q32.1 and 5p15.33

Affiliations

A genome-wide association study identifies pancreatic cancer susceptibility loci on chromosomes 13q22.1, 1q32.1 and 5p15.33

Gloria M Petersen et al. Nat Genet. 2010 Mar.

Abstract

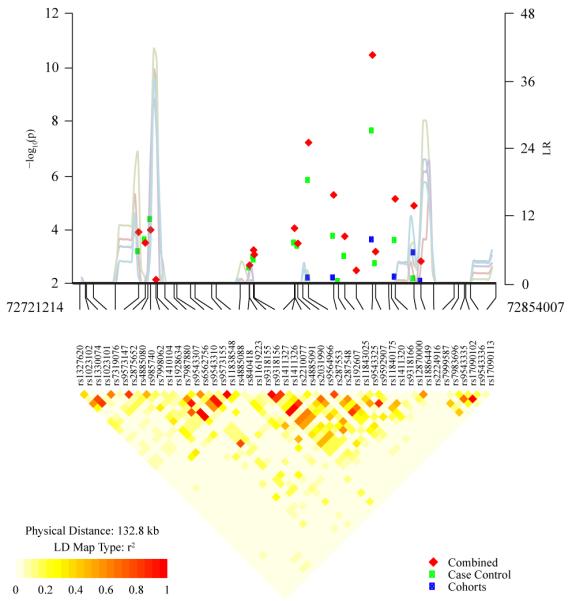
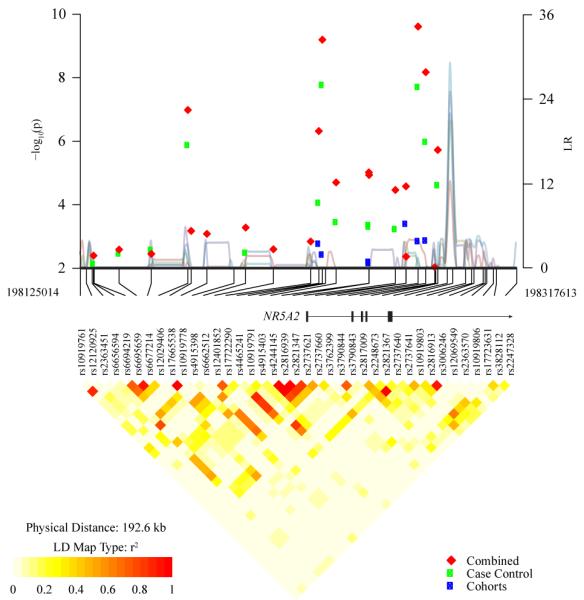
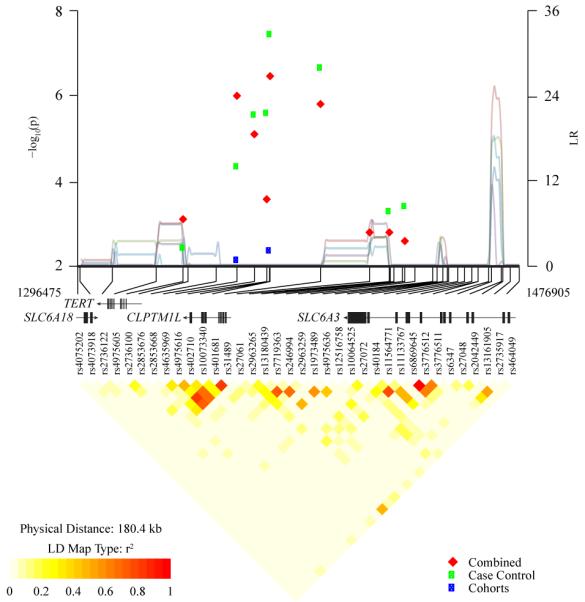
We conducted a genome-wide association study of pancreatic cancer in 3,851 affected individuals (cases) and 3,934 unaffected controls drawn from 12 prospective cohort studies and 8 case-control studies. Based on a logistic regression model for genotype trend effect that was adjusted for study, age, sex, self-described ancestry and five principal components, we identified eight SNPs that map to three loci on chromosomes 13q22.1, 1q32.1 and 5p15.33. Two correlated SNPs, rs9543325 (P = 3.27 x 10(-11), per-allele odds ratio (OR) 1.26, 95% CI 1.18-1.35) and rs9564966 (P = 5.86 x 10(-8), per-allele OR 1.21, 95% CI 1.13-1.30), map to a nongenic region on chromosome 13q22.1. Five SNPs on 1q32.1 map to NR5A2, and the strongest signal was at rs3790844 (P = 2.45 x 10(-10), per-allele OR 0.77, 95% CI 0.71-0.84). A single SNP, rs401681 (P = 3.66 x 10(-7), per-allele OR 1.19, 95% CI 1.11-1.27), maps to the CLPTM1L-TERT locus on 5p15.33, which is associated with multiple cancers. Our study has identified common susceptibility loci for pancreatic cancer that warrant follow-up studies.


Figures

Figure 1
Figure 1. Association Results, Recombination and Linkage Disequilibrium Plots for 13q22.1, 1q32.1, and 5p15.33
Association results are shown in the top panel for all cohort studies (blue squares), case-control studies (green squares) and all studies combined (red diamonds). Overlaid on the association panel for each locus is a plot of recombination rates (cM/Mb) across the region from CEU study controls. A. The LD plot shows a region of chromosome 13q22.1 marked by SNPs, rs9543325 and rs9564966 and bounded by SNPs between chromosome 13q22.1:72,721,214-72,854,007. These SNPs are within a 600 kb intergenic region between KLF5 and KLF12. B. The LD plot shows a region of chromosome 1q32.1 marked by 5 SNPs, rs3790844, rs10919791, rs3790843, rs12029406 and rs4465241 and bounded by SNPs between chromosome 1q32.1:198,125,014-198,317,613. Note that rs3790844 and rs3790843are located in the first intron of the NR5A2 gene, shown above the LD plot. C. The LD plot shows a region of chromosome 5p15.33 marked by rs401681and bounded by SNPs between chr5p15.33: 1,296,475-1,476,905. rs401681 is located in the 13th intron of the CLPTM1L gene, shown above the LD plot and 27 kb from the TERT gene. For all panels, LD (r2) is depicted for SNPs with MAF > 5% using PanScan Controls of European background (n=3,650 unrelated individuals). Locations are from NCBI Genome Build 36.

References

    1. Ferlay J, Bray F, Pisani P, Parkin DM. IARC CancerBase. No. 5. IARCPress; Lyon: 2004. GLOBOCAN 2002: Cancer Incidence, Mortality and Prevalence Worldwide.
    1. Anderson KE,MT, Silverman D. Cancer of the pancreas. In: Schottenfeld D, Fraumeni JJ, editors. Cancer Epidemiology and Prevention. Oxford University Press; New York: 2006.
    1. Shi C, Hruban RH, Klein AP. Familial pancreatic cancer. Arch Pathol Lab Med. 2009;133:365–74. - PMC - PubMed
    1. Jones S, et al. Exomic sequencing identifies PALB2 as a pancreatic cancer susceptibility gene. Science. 2009;324:217. - PMC - PubMed
    1. Tischkowitz MD, et al. Analysis of the gene coding for the BRCA2-interacting protein PALB2 in familial and sporadic pancreatic cancer. Gastroenterology. 2009;137:1183–6. - PMC - PubMed