. 2010 Feb;7(2):148-55.
doi: 10.1038/nmeth.1418. Epub 2010 Jan 24.

Systems analysis of EGF receptor signaling dynamics with microwestern arrays

Affiliations

Systems analysis of EGF receptor signaling dynamics with microwestern arrays

Mark F Ciaccio et al. Nat Methods. 2010 Feb.

Abstract

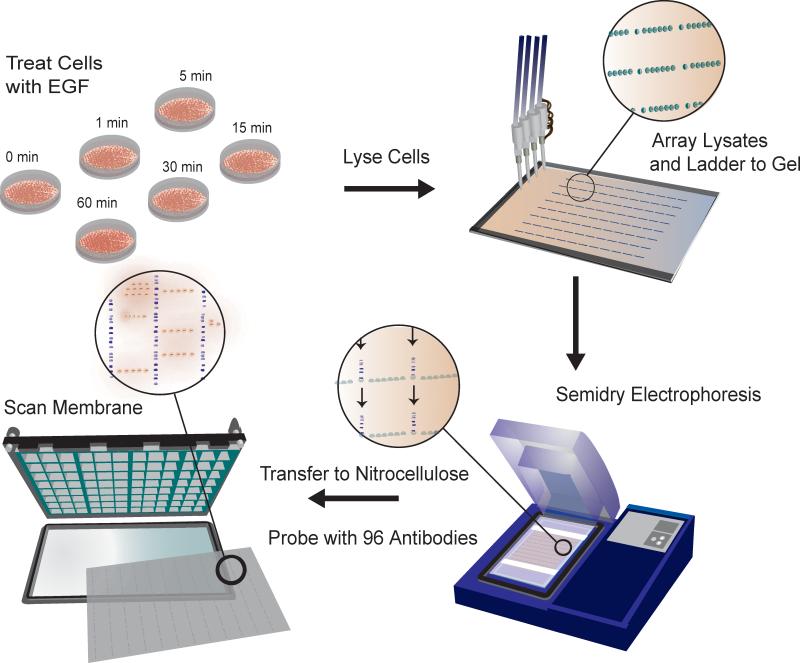
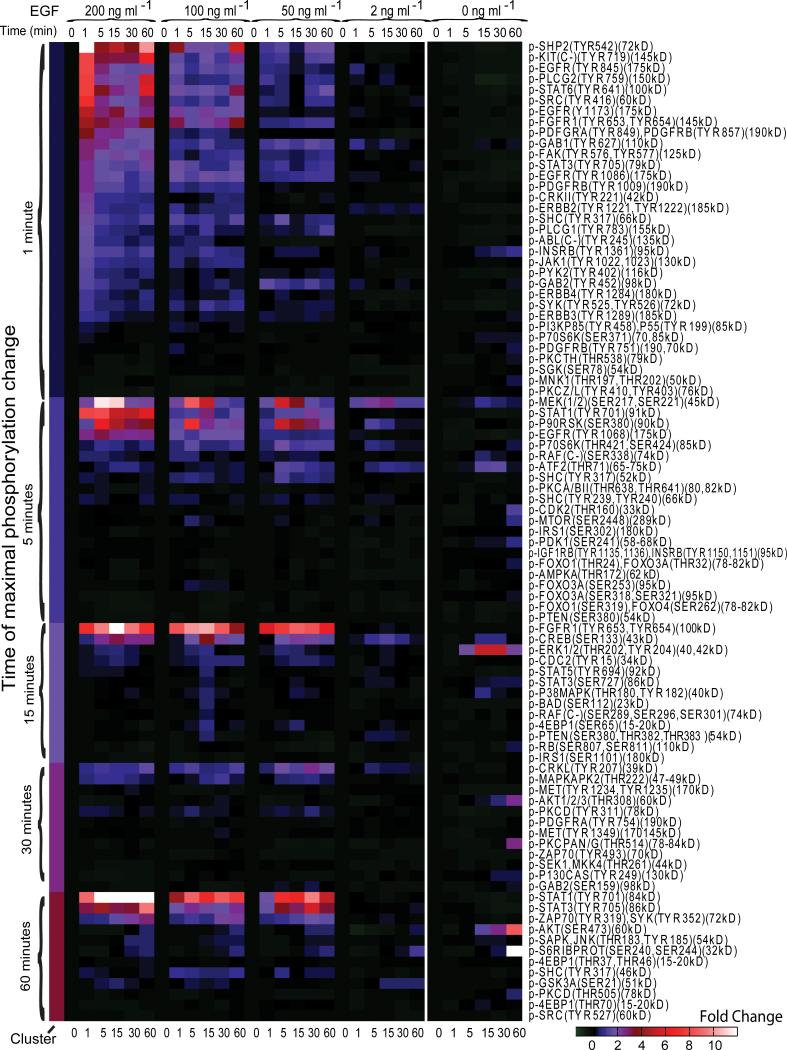
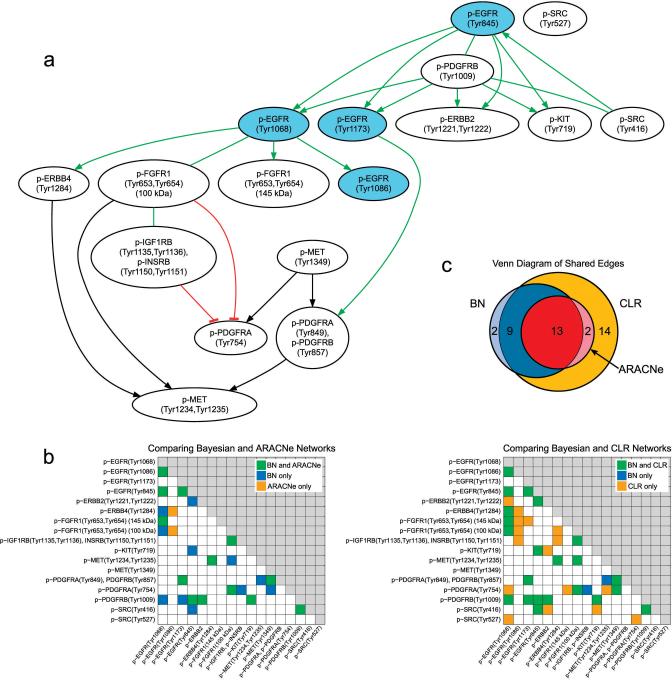
We describe microwestern arrays, which enable quantitative, sensitive and high-throughput assessment of protein abundance and modifications after electrophoretic separation of microarrayed cell lysates. This method allowed us to measure 91 phosphosites on 67 proteins at six time points after stimulation with five epidermal growth factor (EGF) concentrations in A431 human carcinoma cells. We inferred the connectivities among 15 phosphorylation sites in 10 receptor tyrosine kinases (RTKs) and two sites from Src kinase using Bayesian network modeling and two mutual information-based methods; the three inference methods yielded substantial agreement on the network topology. These results imply multiple distinct RTK coactivation mechanisms and support the notion that small amounts of experimental data collected from phenotypically diverse network states may enable network inference.


Figures

Fig. 1
Fig. 1. Micro-western array (MWA) procedure
Procedural schematic for the micro-western array method.
Fig. 2
Fig. 2. MWA Validation of Linear Response
(a) (left) 5 μL of a series of 1/2 dilutions of LI-COR protein ladder were electrophoresed using traditional 10% SDS-PAGE. (right) 60 nl of the identical samples were run in the micro-western format. The difference in scale is noted below the figure. (b) The median net signal intensity was quantified for three bands (150 kDa, 50 kDa, and 25 kDa) of the LI-COR protein ladder in the traditional western blot as shown in part (a). The intensity vs. concentration of proteins displayed a linear relationship for all protein bands quantified. (c) The median net signal intensities quantified from micro-western dilution series. The intensity vs. concentration displayed a similar linear relationship as that from the traditional western. (d) 1/2 dilutions of lysates from A431 cells stimulated for 5 min with 200 ng ml-1 of EGF probed with seven rabbit primary antibodies directed at proteins spanning a range of molecular weights (175 kDa to 15 kDa) and detected with IR700-labeled secondary antibody. (e) The median net signal intensity for each band vs. relative concentration as shown in part (d). The graphs show a linear relationship between net fluorescence and concentration for all antibodies tested.
Fig. 3
Fig. 3. Comparison of MWA to traditional western blot
A comparison of eleven traditional western blots is shown parallel to the identical samples run in triplicate in micro-western array format. Lysates from A431 cells stimulated with EGF (200 ng ml-1) and lysed at 0,1,5,15,30, and 60 minutes after stimulation along with the LI-COR protein ladder. β-actin monoclonal mouse primary antibody (detected with IR800 secondary antibody shown in green) was probed with each of the eleven rabbit primary antibodies (detected with IR700 secondary antibody shown in red) polyclonal antibodies to demonstrate equal loading of each sample. An arrow indicating the band quantified is indicated to the left of the blot along with the corresponding sizes of the LI-COR protein standard. Quantification of the fluorescence of the traditional western (red) is shown in comparison to the micro-western (blue). Error bars shown represent the standard error of the three technical replicates of the micro-westerns shown. Absolute sizes of the blots are indicated below to demonstrate the extent of the miniaturization of scale of the micro-western in comparison to the traditional western Blot.
Fig. 4
Fig. 4. An MWA containing 6 cell lysates probed with 192 antibodies
The red channel (700 nm laser) shows the stimulation of A431 cells with 200 ng/ml EGF probed with a panel of rabbit anti-human polyclonal antibodies detected with IR700-labeled secondary antibodies. The green channel (800 nm laser) reflects a scan of the samples probed with mouse monoclonal antihuman β-actin antibody detected with IR800-labeled secondary antibodies to demonstrate the consistency of printing across the area of the membrane. For antibody layout, see Supplementary Table 2.
Fig. 5
Fig. 5. A clustered heatmap profile of fold changes for antibody bands representing specific phosphorylation sites of proteins in A431 cells over six time points for four stimulation conditions and one 0 ng ml-1 control
The net fold-change is color coded as indicated in the legend. Antibody bands are clustered into six clusters according to the time point (0, 1, 5, 15, 30, or 60 min) at which maximal fold change occurs. The antibodies are in descending order sorted in each cluster by the value of the fold change at the 200 ng ml-1 stimulation condition at the time point representative of that particular cluster. The antibody names are listed as given by the manufacturer followed in parentheses by an approximation of the size of each band. The EGF mock stimulation is shown on the right image block.
Fig. 6
Fig. 6
Consensus model of EGFR receptor level influences modeled by Bayesian network inference with comparison to ARACNe and CLR. (a) A consensus model of the EGF signaling network obtained by exact Bayesian model averaging following Bayesian network inference (Supplementary Note 1). Significant (p < 0.001) positive edges (green), significant (p < 0.05) negative edges (red blunt edges), and interactions with a non-significant correlation coefficient (black) are shown. Edges for which the directionality could not be determined using equivalence class analysis are shown as undirected. (b) Heatmaps show the undirected adjacency matrices comparing the Bayesian network to the ARACNe and CLR networks. An edge between node i and node j is represented by matrix value (i, j). Because the undirected networks are compared, the adjacency matrix is symmetric across the diagonal, and thus only the lower triangular matrix of the adjacency matrix is shown. Edge weight thresholds were set to > 0.3 for the Bayesian network and ARACNe (using ARACNe Data Processing Inequality parameter τ= 0.03) and to Z > 1.13 for CLR. Eight of 11 edges present only in the Bayesian network and not in the ARACNe network would induce three-node triplets in the ARACNe network, which is precisely what ARACNe is designed to prune out (see Supplementary Figure 8). (c) Venn diagram comparing edges across the three networks. The ARACNe network forms a complete subnetwork of the CLR network and a near complete subnetwork of the Bayesian network, which forms a near complete subnetwork of the CLR network.

Similar articles

Cited by

References

    1. Burnette W. Western Blotting”: Electrophoretic transfer of proteins from sodium dodecyl sulfate polyacrylamide gels to unmodified nitrocellulose and radiographic detection with antibody and radioiodinated protein A. Analytical Biochemistry. 1981;112:195–203. - PubMed
    1. Paweletz CP, Liotta LA, Petricoin EF. New technologies for biomarker analysis of prostate cancer progression: Laser capture microdissection and tissue proteomics. Urology. 2001;57:160–3. - PubMed
    1. Paweletz CP, et al. Reverse phase protein microarrays which capture disease progression show activation of pro-survival pathways at the cancer invasion front. Oncogene. 2001;20:1981–9. - PubMed
    1. Sevecka M, MacBeath G. State-based discovery: a multidimensional screen for small-molecule modulators of EGF signaling. Nature Methods. 2006;3:825–31. - PMC - PubMed
    1. Sachs K, Perez O, Pe'er D, Lauffenburger DA, Nolan GP. Causal Protein-Signaling Networks Derived from Multiparameter Single-Cell Data. Science. 2005;308:523–529. - PubMed

Publication types

MeSH terms