

How established wait time benchmarks significantly underestimate total wait times for cardiac surgery
- PMID: 20101361
- PMCID: PMC2827229
- DOI: 10.1016/s0828-282x(10)70337-8
How established wait time benchmarks significantly underestimate total wait times for cardiac surgery
Abstract
Background: Wait times for cardiac surgery are well established but may not reflect the total wait time patients experience.
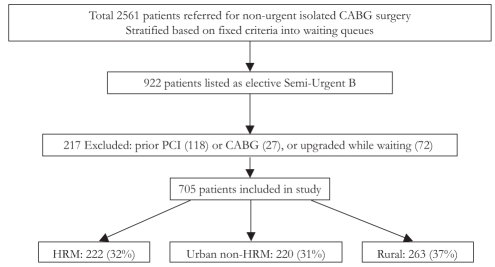
Methods: The Maritime Heart Center (Halifax, Nova Scotia) cardiac surgery database was used to identify all consecutive patients who underwent elective coronary artery bypass graft surgery between 2002 and 2005 from a single urgency queue. The provincial physician billing database provided a timeline record of dates, physician visits, and diagnoses or procedures performed for each patient. This information was used to assess total and component wait times leading to cardiac surgery.
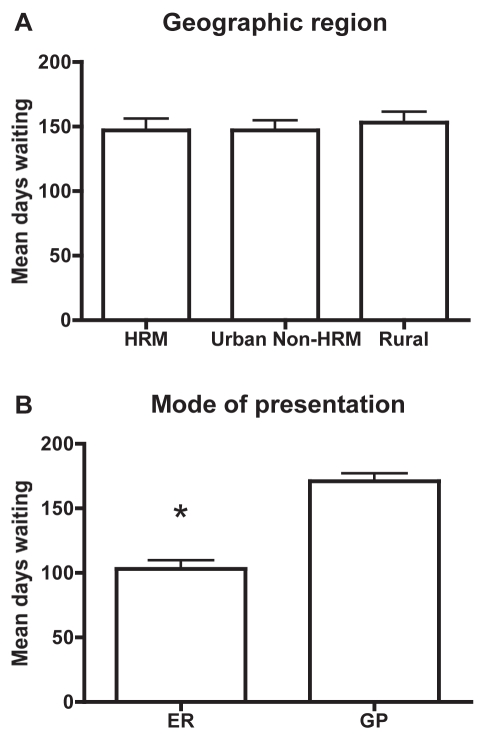
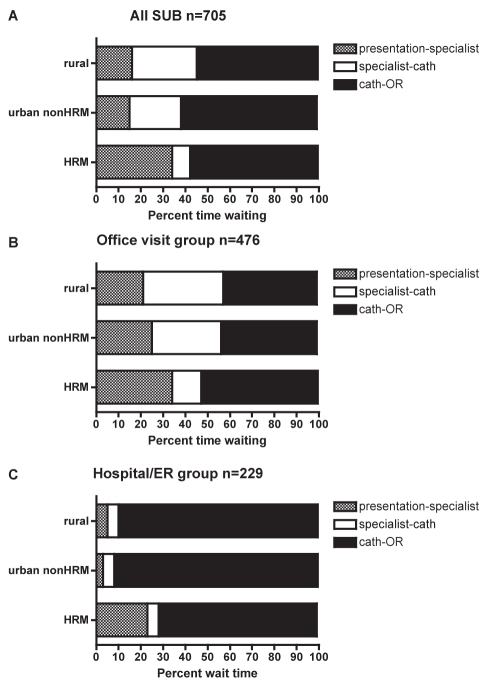
Results: A total of 705 consecutive patients were included and stratified based on geographical location: urban Halifax Regional Municipality (HRM; n=222), urban non-HRM (n=220) and rural (n=263). Patients from all regions did not differ in age, sex, comorbidities or ventricular function. Using a traditional definition of wait time (time listed), patients waited a median of 56 days (interquartile range [IQR] 38 to 77 days). In comparison, the total wait times based on the time from presentation to surgery were a median of 109 days (IQR 56 to 184 days) for HRM, a median of 121 days (IQR 77 to 184 days) for urban non-HRM and a median of 123 days (IQR 79 to 169 days) for rural patients (P-value nonsignificant). Two modes of presentation emerged that were not influenced by a patient's geographical location. Patients who presented to the emergency department (n=229) waited a median of 73 days. This was significantly less than patients who presented to their family physician (n=476), who waited a median of 135 days (P<0.001). The difference in overall wait for patients presenting to the emergency room was a result of a shorter wait time for referral to a specialist and from seeing a specialist to catheterization.
Conclusion: The present pilot study demonstrated that total patient wait times for cardiac care and surgery in Nova Scotia are significantly longer (more than twofold) than traditionally reported wait times for surgery alone.
HISTORIQUE :: Les temps d’attente avant une chirurgie cardiaque sont bien établis, mais ne reflètent pas le temps d’attente total que vivent les patients.
MÉTHODOLOGIE :: Les auteurs ont utilisé las base de données des chirurgies cardiaques du Maritime Health Centre de Halifax, en Nouvelle-Écosse, pour repérer tous les patients consécutifs qui avaient subi un pontage aortocoronarien non urgent entre 2002 et 2005 et qui provenait de la même liste d’attente. La base de données provinciale de facturation par les médecins a fourni un calendrier des dates, des visites chez le médecin et des diagnostics ou des interventions exécutées auprès de chaque patient. Ces renseignements ont permis d’évaluer le temps d’attente total et celui de chaque volet avant la chirurgie cardiaque.
RÉSULTATS :: Au total, 705 patients consécutifs ont été inclus dans l’étude et stratifiés selon leur lieu géographique : municipalité régionale du Halifax urbain (MRH, n=222), région urbaine hors MRH (n=220) et région rurale (n=263). Les patients de toutes les régions ne différaient pas selon l’âge, le sexe, les comorbidités et la fonction ventriculaire. Au moyen de la définition traditionnelle des temps d’attente (le temps inscrit), les patients attendaient une médiane de 56 jours (plage interquartile [PIQ] de 38 à 77 jours). En comparaison, le temps d’attente total d’après le délai entre la présentation et l’opération était d’une médiane de 109 jours (PIQ de 56 à 184 jours) dans la MRH, d’une médiane de 121 jours (PIQ de 77 à 184 jours) dans la région urbaine hors MRH et d’une médiane de 123 jours (PIQ de 79 à 169 jours) chez les patients des régions rurales (valeur P non significative). Deux modes de présentation qui n’étaient pas influencés par le lieu géographique des patients ont émergé. Les patients qui consultaient à l’urgence (n=229) attendaient une médiane de 73 jours. C’était considérablement moins long que les patients qui consultaient leur médecin de famille (n=476), qui attendaient une médiane de 135 jours (P<0,001). La différence des temps d’attente globaux pour les patients qui arrivent à l’urgence résultait d’un moins long délai avant d’être orientés vers un spécialiste et entre la consultation d’un spécialiste et le cathétérisme.
CONCLUSION :: La présente étude pilote démontre que le temps d’attente total des patients avant de recevoir des soins cardiaques et de se faire opérer en Nouvelle-Écosse est considérablement (plus de deux fois) plus long que les temps d’attente habituellement déclarés avant la seule chirurgie.
Figures
Comment in
-
Still waiting after all these years.Can J Cardiol. 2010 Jan;26(1):e22-3. doi: 10.1016/s0828-282x(10)70338-x. Can J Cardiol. 2010. PMID: 20101362 Free PMC article. No abstract available.
References
-
- Ray AA, Buth KJ, Sullivan JA, Johnstone DE, Hirsch GM. Waiting for cardiac surgery: Results of a risk-stratified queuing process. Circulation. 2001;104:I92–I8. - PubMed
-
- Cox JL, Petrie JF, Pollak PT, Johnstone DE. Managed delay for coronary artery bypass graft surgery: The experience at one Canadian center. J Am Coll Cardiol. 1996;27:1365–73. - PubMed
MeSH terms
LinkOut - more resources
Full Text Sources
Medical
