. 2011 Apr;21(4):354-73.
doi: 10.1002/hipo.20768.

Coordination of size and number of excitatory and inhibitory synapses results in a balanced structural plasticity along mature hippocampal CA1 dendrites during LTP

Affiliations

Coordination of size and number of excitatory and inhibitory synapses results in a balanced structural plasticity along mature hippocampal CA1 dendrites during LTP

Jennifer N Bourne et al. Hippocampus. 2011 Apr.

Abstract

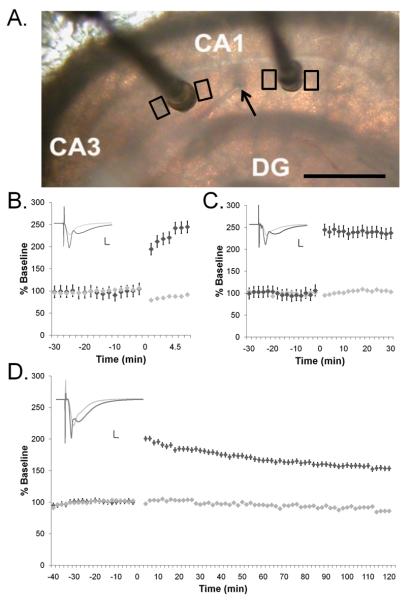
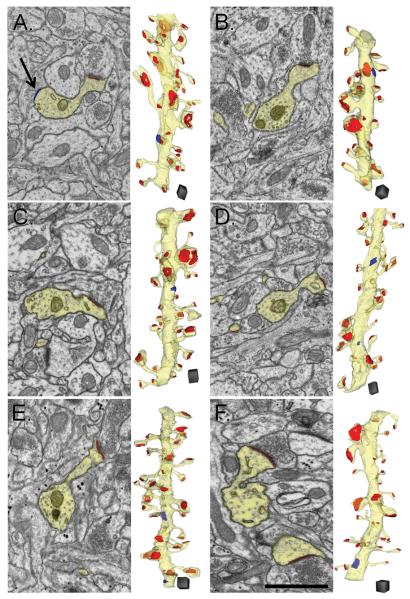
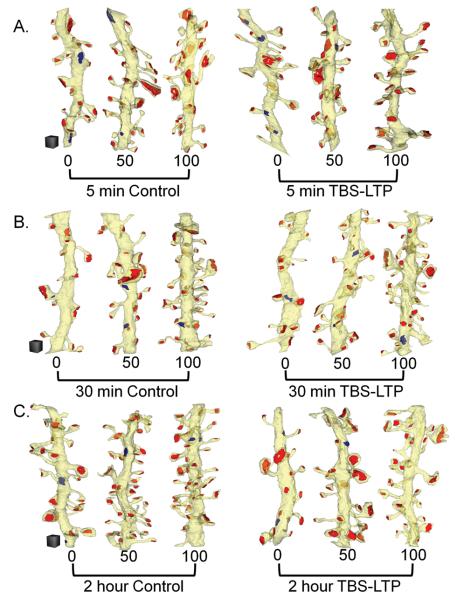
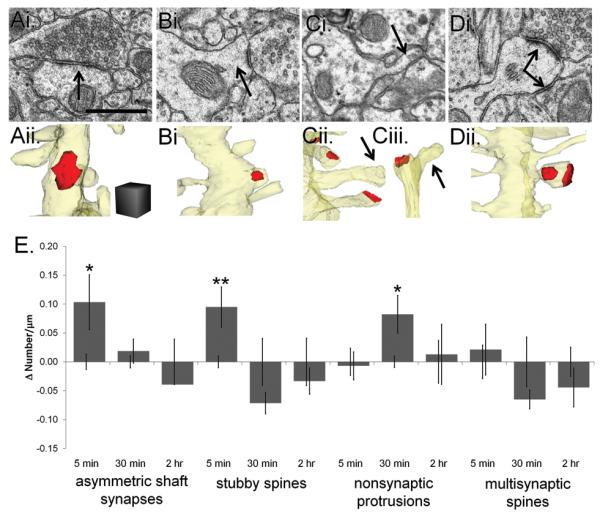
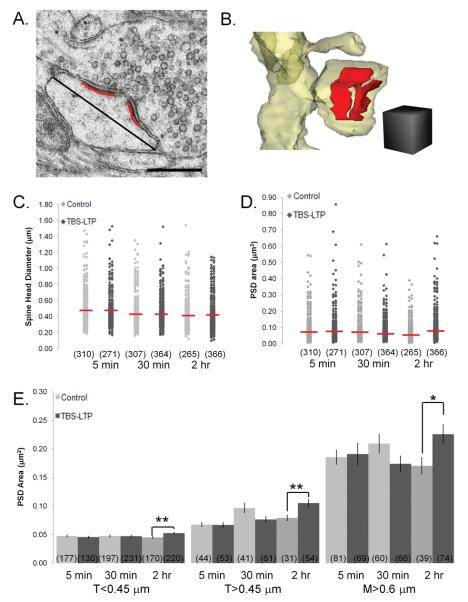
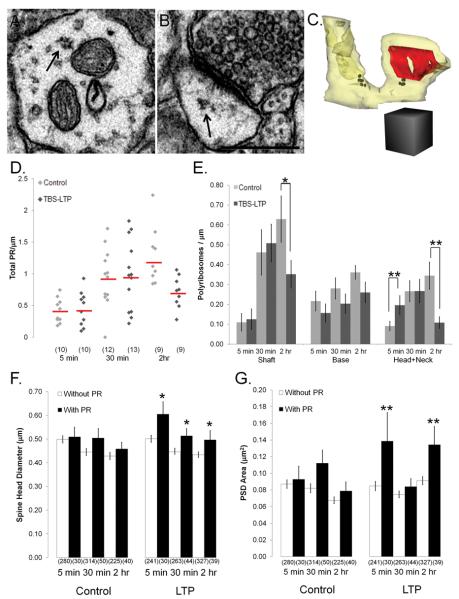
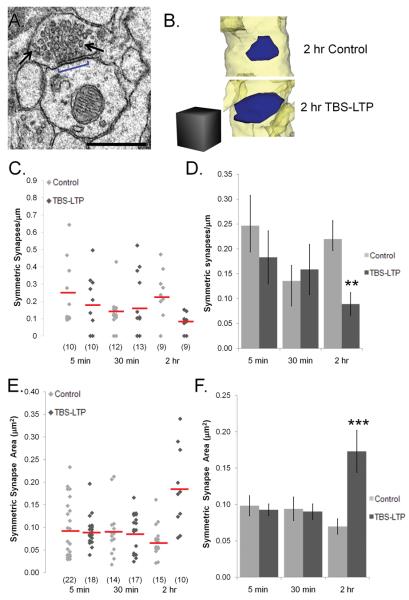
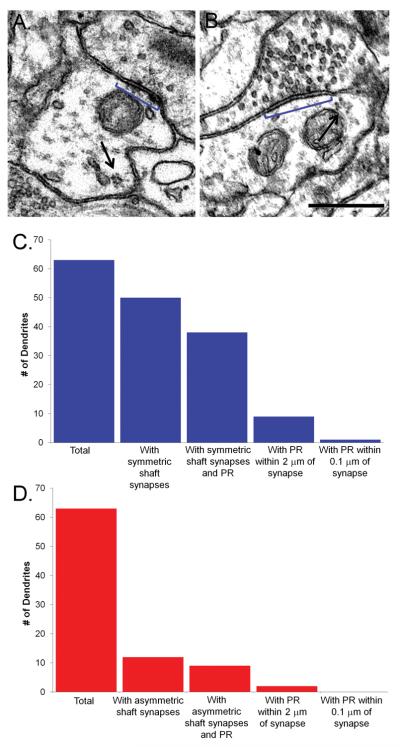
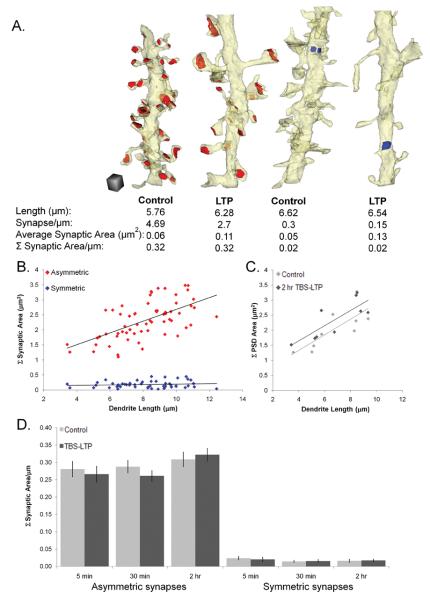
Enlargement of dendritic spines and synapses correlates with enhanced synaptic strength during long-term potentiation (LTP), especially in immature hippocampal neurons. Less clear is the nature of this structural synaptic plasticity on mature hippocampal neurons, and nothing is known about the structural plasticity of inhibitory synapses during LTP. Here the timing and extent of structural synaptic plasticity and changes in local protein synthesis evidenced by polyribosomes were systematically evaluated at both excitatory and inhibitory synapses on CA1 dendrites from mature rats following induction of LTP with theta-burst stimulation (TBS). Recent work suggests dendritic segments can act as functional units of plasticity. To test whether structural synaptic plasticity is similarly coordinated, we reconstructed from serial section transmission electron microscopy all of the spines and synapses along representative dendritic segments receiving control stimulation or TBS-LTP. At 5 min after TBS, polyribosomes were elevated in large spines suggesting an initial burst of local protein synthesis, and by 2 h only those spines with further enlarged synapses contained polyribosomes. Rapid induction of synaptogenesis was evidenced by an elevation in asymmetric shaft synapses and stubby spines at 5 min and more nonsynaptic filopodia at 30 min. By 2 h, the smallest synaptic spines were markedly reduced in number. This synapse loss was perfectly counterbalanced by enlargement of the remaining excitatory synapses such that the summed synaptic surface area per length of dendritic segment was constant across time and conditions. Remarkably, the inhibitory synapses showed a parallel synaptic plasticity, also demonstrating a decrease in number perfectly counterbalanced by an increase in synaptic surface area. Thus, TBS-LTP triggered spinogenesis followed by loss of small excitatory and inhibitory synapses and a subsequent enlargement of the remaining synapses by 2 h. These data suggest that dendritic segments coordinate structural plasticity across multiple synapses and maintain a homeostatic balance of excitatory and inhibitory inputs through local protein-synthesis and selective capture or redistribution of dendritic resources.


Figures

Figure 1
Figure 1
Site-specific TBS-LTP in hippocampal slices from adult rats. (A) A single recording electrode (arrow) was positioned in the middle of s. radiatum midway between two stimulating electrodes (dark posts). Tissue for analyses was collected immediately adjacent to the stimulating electrodes (black boxes) after microwave-enhanced fixation. Scale bar = 500 μm. Theta burst stimulation (TBS) was delivered to one of the stimulating electrodes at time 0 to induce LTP (dark gray diamonds) while baseline stimulation was maintained at the other electrode (light gray diamonds). The responses were monitored for (B) 5 min (n=3 slices from 3 animals), (C) 30 min (n=3 slices from 3 animals), or (D) 2 hr (n=2 slices from 2 animals) after the delivery of the first theta burst stimulation. Example waveforms for each time (insets) are an average of the pre-TBS and post-TBS responses at the control (light gray) and TBS-LTP (dark gray) sites. Scale bars = 5mV/5ms.
Figure 2
Figure 2
Electron micrographs (EMs) of representative fields of neuropil illustrate high quality of tissue preservation from each time and condition. Sample dendrites and their spines were outlined and reconstructed in yellow. Asymmetric excitatory PSDs located on these dendrites were highlighted and reconstructed in red while symmetric shaft synapses were highlighted (arrow) and reconstructed in blue. Dendrites and surrounding neuropil in (A) a 5 min control, (B) a 5 min TBS-LTP series, (C) a 30 min control, (D) a 30 min TBS-LTP series, (E) a 2 hr control and (F) a 2 hr TBS-LTP series. Scale bar = 1 micron. Scale cube = 0.5 μm on a side.
Figure 3
Figure 3
Example reconstructed dendritic segments from each condition, ranked according to spine density and displayed at comparable percentile ranks of 0, 50 and 100 from the Control or TBS-LTP sites at (A) 5 min, (B) 30 min, or (C) 2 hr after induction of TBS-LTP. All of the excitatory (red) and inhibitory (blue) synapses were reconstructed on each dendritic segment. Scale cubes equal 0.5 μm on a side and were matched for all conditions and times.
Figure 4
Figure 4
Transitional structures emerged soon after the induction of TBS-LTP. (Ai) EM (arrow) and (Aii) 3D reconstruction of an asymmetric excitatory shaft synapse, which was unambiguously identified by comparing the typical PSD thickness with neighboring spine PSDs and confirming the identity by following the axon until it synapsed on a dendritic spine. Scale bar and cube = 0.5 μm on a side for A-D. (Bi) EM (arrow) and (Bii) reconstruction of a stubby spine. Reconstruction of a nonsynaptic filopodia emerging from (Ci, Cii) a dendritic shaft (arrow), or (Ciii) a dendritic spine (arrow). (D) EM of a spine with two synapses (arrows) formed by different presynaptic axons. (Di) Reconstruction of the same multisynaptic spine. (E) To visualize changes in transitional structures, we subtracted the mean control value from the mean TBS-LTP value for each time (Δ Number/μm) and plot here the differences relative to the control values which were normalized to zero while maintaining the error bars from statistical analyses of the absolute mean values for both control and TBS-LTP. Asymmetric shaft and stubby spine synapses were increased at 5 min and more nonsynaptic filopodia were present at 30 min (*p<0.05, **p<0.01). There was no significant change in multisynaptic spines at any time following TBS-LTP induction.
Figure 5
Figure 5
A decrease in the smallest thin spines accounted for a TBS-LTP specific reduction in dendritic spine density at 2 hr. (Ai) EM of a thin spine (arrow). Scale bar = 0.5 μm for all EMs. (Aii) Reconstruction of a dendritic segment where two thin spines were illustrated with each of their PSDs reconstructed in red. Scale cube = 0.5 μm on a side for all reconstructions. (Bi) EM (arrow) and (Bii) reconstruction of a mushroom spine. Black lines in (Ai) and (Bi) indicate where the measurements of spine heads were obtained at their greatest width parallel to the PSD. (Ci) EM of both heads of a branched spine, where the branch point was visualized on adjacent serial sections (see Supplemental Figure 2I-L). (Cii) Reconstructed branched spines with one mushroom head and one thin head and (Ciii) with two thin heads. (D) The distribution in spine density of control dendrites (light gray diamonds) and TBS-LTP dendrites (dark gray diamonds) is plotted for each time. The red horizontal lines represent the means (n= number of dendrites). (E) Comparison of typical spine frequency based on head diameters where there was a significant decrease in thin <0.45 spines at the 2 hr time point (*p<0.05) but no change in larger spines or at other time points.
Figure 6
Figure 6
PSD enlargement by 2 hr after induction of TBS-LTP without significant change in spine head diameter. (A) EM of a dendritic spine head from the 2 hr TBS-LTP condition, with a red line along a cross-sectioned PSD length showing a gap where it is perforated by an electron lucent region. The black line indicates spine head diameter measurements taken at the widest part of the dendritic spine parallel to the PSD. Scale bar = 0.5 μm. (B) Reconstruction of the perforated PSD (red) on the mushroom spine depicted in (A). Scale cube = 0.5 μm on a side. (C) Distribution of all spine head diameters with red horizontal lines indicating means for each time point for control (light gray diamonds) and TBS-LTP (dark gray diamonds) conditions (n=number of spines). Average spine head diameter was not significantly changed after the induction of TBS-LTP. (D) The PSD area of every excitatory synapse was plotted at 5 min, 30 min, and 2 hr to visualize the range in size across control (light gray diamonds) and TBS-LTP (dark gray diamonds) dendrites. Red horizontal lines indicate the mean for each time and condition (n=number of synapses). (E) At 2 hr average PSD area was increased for spines of all sizes (n=number of synapses) (*p<0.05, **p<0.01).
Figure 7
Figure 7
Timing of changes in the density and location of polyribosomes after induction of TBS-LTP. Polyribosomes had 3 or more individual ribosomes with opaque centers (~15-25 nm) surrounded by lighter irregular edges as illustrated (A) in a dendritic shaft (arrow) and (B) in a spine head (arrow). (See also Supplemental Figure 4). Scale bar = 0.5 μm. (C) Reconstruction of a mushroom spine with a large perforated PSD (red) and containing a polyribosome (black spheres) at the base of the spine and a polyribosome in its head. Scale cube = 0.5 μm on a side. (D) The distribution of total polyribosome density for control (light gray diamonds) and TBS-LTP (dark gray diamonds) dendrites was plotted for each time and condition. Red horizontal lines indicate means for each population of dendrites (n=number of dendrites). (E) Relative to controls, polyribosomes were elevated in spine heads and necks at 5 min after induction of LTP but were reduced in the dendritic shaft and in spine heads and necks by 2 hr (*p<0.05; **p<0.01). (F) Spines with polyribosomes had significantly larger heads at all times after induction of TBS-LTP (p<0.05) (n=number of spines). (G) At 5 min and 2 hr after the induction of LTP, spines with polyribosomes had significantly larger PSDs (**p<0.01) whether the polyribosomes were in the head, neck or base of the spine (n= PSDs on the same spines as in F).
Figure 8
Figure 8
Reduced frequency and enlargement of symmetric synapses at 2 hr after TBS-LTP was produced at excitatory synapses in s. radiatum. (A) EM of a symmetric synapse (blue bracket) with small pleiomorphic presynaptic vesicles (arrows). Scale bar = 0.5 μm. (B) Reconstructions of symmetric synaptic surface areas (blue) from 2 hr control and TBS-LTP dendrites. Scale cube = 0.5 μm on a side. (C) The distribution of symmetric synapse density was plotted for every control (light gray diamonds) and TBS-LTP (dark gray diamonds) and red horizontal lines indicate means for each time point and condition (n=number of dendrites). (D) Relative to controls, fewer symmetric synapses occurred at 2 hr (**p<0.01) with no significant change at 5 or 30 min after TBS. (E) The surface area of each symmetric synapse on control (light gray diamonds) and TBS-LTP (dark gray diamonds) dendrites was plotted with red lines indicating means for each time point and condition (n=number of synapses). (F) There was an increase in the surface area of symmetric synapses (***p<0.001) at 2 hr after the induction of TBS-LTP.
Figure 9
Figure 9
Polyribosomes were not associated with symmetric or asymmetric shaft synapses in the middle of s. radiatum. (A) An EM of a symmetric synapse (blue bracket) with a polyribosome (arrow) located in the dendritic shaft >0.1 micron away. (B) An EM of the one symmetric synapse (blue bracket) with a polyribosome (arrow) located <0.1 micron away. Scale bar = 0.5 μm. (C) All dendrites (n=63) were divided into those with symmetric synapses (n=50) and then further separated into those with symmetric synapses and shaft polyribosomes (n=38). Dendrites that had polyribosomes within 2 microns of a symmetric synapse (n=9) were finally parsed down to one dendrite that had a polyribosome within 0.1 micron of a symmetric synapse, the cutoff distance that was used to assign a polyribosome to a dendritic spine. (D) All dendrites (n=63) were divided into those with asymmetric shaft synapses (n=12) and then further separated into those with asymmetric shaft synapses and shaft polyribosomes (n=9). There were 2 dendrites that had polyribosomes within 2 microns of an asymmetric shaft synapse but there were not any asymmetric shaft synapses that had a polyribosome within 0.1 micron.
Figure 10
Figure 10
Balancing total PSD area along reconstructed dendrites. (A) Reconstructions of control and TBS-LTP dendrites cropped to approximately equal lengths demonstrate equal summed asymmetric or symmetric synaptic areas per micron despite large differences in average synapse size and density. Scale cube = 0.5 μm on each side. (B) Summed asymmetric PSD area was well correlated with dendritic length across all dendrites (red diamonds, n=63 dendrites; r=0.6, p<0.001) but summed surface area of symmetric synapses was not (blue diamonds; r=0.12, n.s.). (C) This correlation applied also to control (light gray diamonds; r=0.8, p<0.05) and LTP (dark gray diamonds; r=0.8, p<0.01) dendrites at 2 hr after the induction of TBS-LTP. (D) Average summed asymmetric or symmetric surface area per micron length of dendrite was the same for dendrites across all time points in the control and TBS-LTP conditions (p>0.8).
Figure 11
Figure 11
Model of how induction of TBS-LTP results in rearrangement of excitatory and inhibitory synapses and a redistribution of polyribosomes. (A) Representation of a control dendrite (yellow) from the 5 min condition has excitatory (red) and inhibitory (blue) synapses and spines of all sizes, including small thin spines with diameters < 0.45 microns (gray spines). The frequency of polyribosomes in these dendrites was relatively low (black circles). (A′) At 5 min after TBS-LTP induction, asymmetric shaft synapses and stubby spines increased and polyribosomes were elevated in large spines with large synapses because mRNAs (black lines) were unmasked. (B) By 30 min, baseline stimulation in control dendrites had recruited polyribosomes while (B′) induction of TBS-LTP resulted in the emergence of nonsynaptic protrusions and the localization of polyribosomes to spines that had enlarged heads but had not yet enlarged their PSDs. (C) By 2 hr, control dendrites demonstrated ongoing recovery of small thin spines, possibly in response to baseline stimulation whereas the (C′) induction of TBS-LTP either prevented the formation or promoted the elimination of those spines while enlarging the remaining PSDs. There was also a decrease in the frequency of inhibitory synapses that was accompanied by an enlargement in their size. In addition, polyribosomes decreased in number except in spines with large heads and enlarged PSDs by 2 hr after induction of TBS-LTP. At each time point, the average summed synaptic area per unit length of dendrite for excitatory or inhibitory synapses remained stable across all conditions.

Similar articles

Cited by

References

    1. Aakalu G, Smith WB, Nguyen N, Jiang C, Schuman EM. Dynamic visualization of local protein synthesis in hippocampal neurons. Neuron. 2001;30:489–502. - PubMed
    1. Abraham WC, Huggett A. Induction and reversal of long-term potentiation by repeated high- frequency stimulation in rat hippocampal slices. Hippocampus. 1997;7:137–145. - PubMed
    1. Bliss TVP, Collingridge GL. A synaptic model of memory: long-term potentiation in the hippocampus. Nature. 1993;361:31–39. - PubMed
    1. Bourne J, Harris KM. Do thin spines learn to be mushroom spines that remember? Curr. Opin. Neurobiol. 2007;17:381–386. - PubMed
    1. Bourne JN, Harris KM. Balancing structure and function at hippocampal dendritic spines. Annu. Rev. Neurosci. 2008;31:47–67. - PMC - PubMed

Publication types