

Review
doi: 10.1002/pmic.200900375.
A guided tour of the Trans-Proteomic Pipeline
Affiliations
- PMID: 20101611
- PMCID: PMC3017125
- DOI: 10.1002/pmic.200900375
Item in Clipboard
Review
A guided tour of the Trans-Proteomic Pipeline
Proteomics.
2010 Mar.
Abstract
The Trans-Proteomic Pipeline (TPP) is a suite of software tools for the analysis of MS/MS data sets. The tools encompass most of the steps in a proteomic data analysis workflow in a single, integrated software system. Specifically, the TPP supports all steps from spectrometer output file conversion to protein-level statistical validation, including quantification by stable isotope ratios. We describe here the full workflow of the TPP and the tools therein, along with an example on a sample data set, demonstrating that the setup and use of the tools are straightforward and well supported and do not require specialized informatic resources or knowledge.
Figures
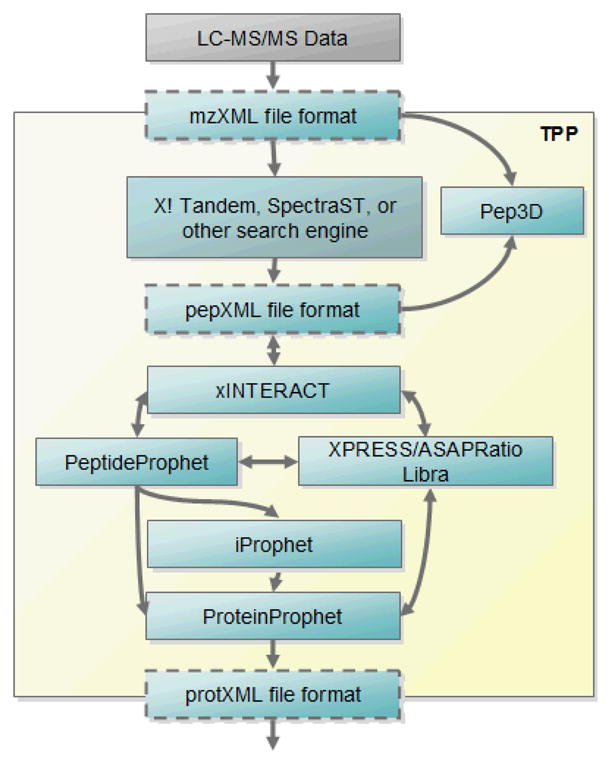
Schematic overview of the TPP workflow. Raw MS/MS data files are first converted to an open XML format such as mzXML or mzML, then analyzed with a search engine, either embedded in the TPP or used externally. Pep3D can allow visualization of the data. The search results, in pepXML format, are processed with tools PeptideProphet for initial spectrum-level validation, iProphet for peptide-level validation, and finally ProteinProphet for protein-level validation and final protein inference. Quantification tools like XPRESS, ASAPRatio, or Libra can be used on labeled data. The final output is protXML, which can be imported into a variety of analysis tools.
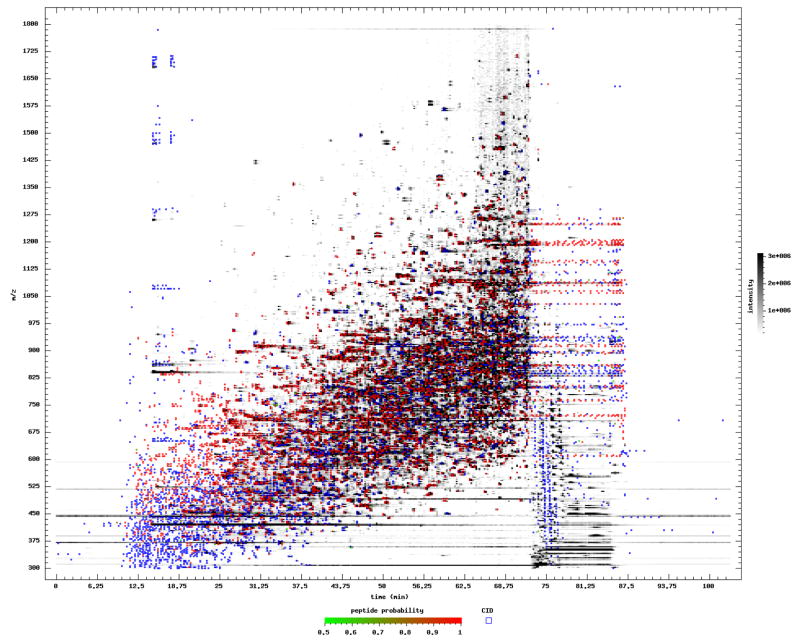
Pep3D visualization of one of the runs in the sample dataset. Elution time in minutes is along the X axis, and m/z is along the Y axis. MS1 intensities are rendered in grayscale. Blue and red squares depict the precursor m/z and time of the MS/MS scans. Red squares denote high probability PSMs as derived by PeptideProphet. Blue squares are low probability PSMs. Although some contaminant streaking is seen at low m/z, the wide ramp of elution features, many of them annotated red as high probability, indicates that this is a good quality run.
References
-
- Aebersold R, Mann M. Mass spectrometry-based proteomics. Nature. 2003;422:198–207. - PubMed
-
- Bantscheff M, et al. Quantitative mass spectrometry in proteomics: a critical review. Anal Bioanal Chem. 2007;389(4):1017–31. - PubMed
-
- Deutsch EW, Lam H, Aebersold R. Data analysis and bioinformatics tools for tandem mass spectrometry in proteomics. Physiol Genomics. 2008;33(1):18–25. - PubMed
-
- Kohlbacher O, et al. TOPP--the OpenMS proteomics pipeline. Bioinformatics. 2007;23(2):e191–7. - PubMed
Publication types
MeSH terms
Grants and funding
LinkOut - more resources
Full Text Sources
Other Literature Sources
