. 2010 Apr;40(4):1022-35.
doi: 10.1002/eji.200939782.

Uptake of apoptotic DC converts immature DC into tolerogenic DC that induce differentiation of Foxp3+ Treg

Affiliations

Uptake of apoptotic DC converts immature DC into tolerogenic DC that induce differentiation of Foxp3+ Treg

Rahul Kushwah et al. Eur J Immunol. 2010 Apr.

Abstract

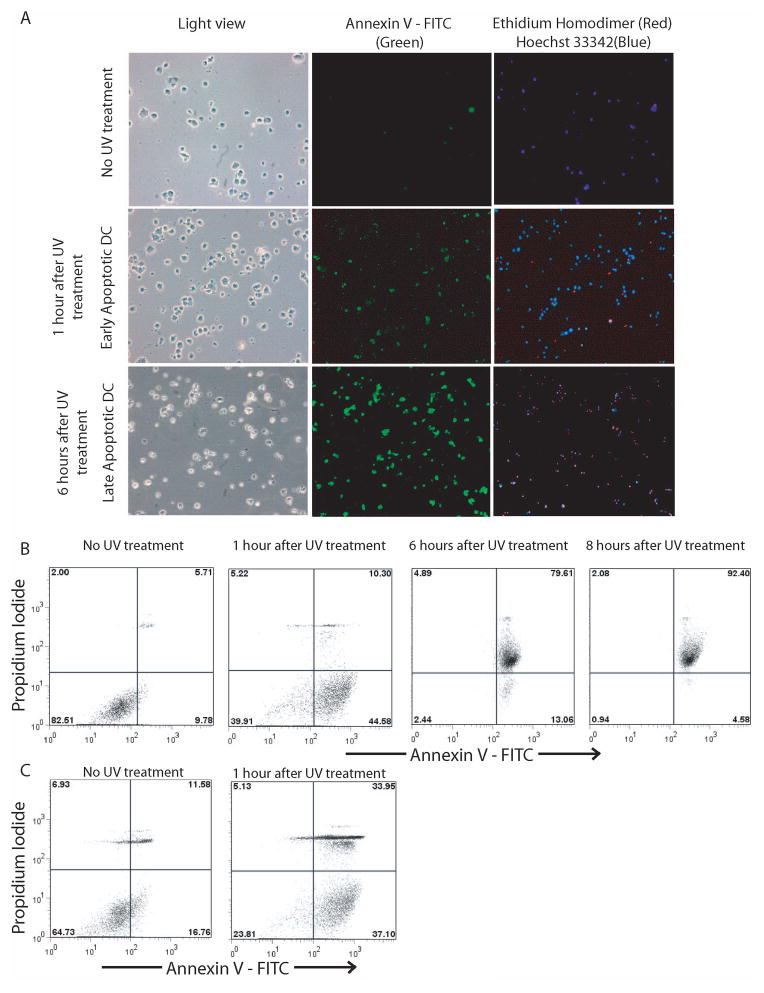
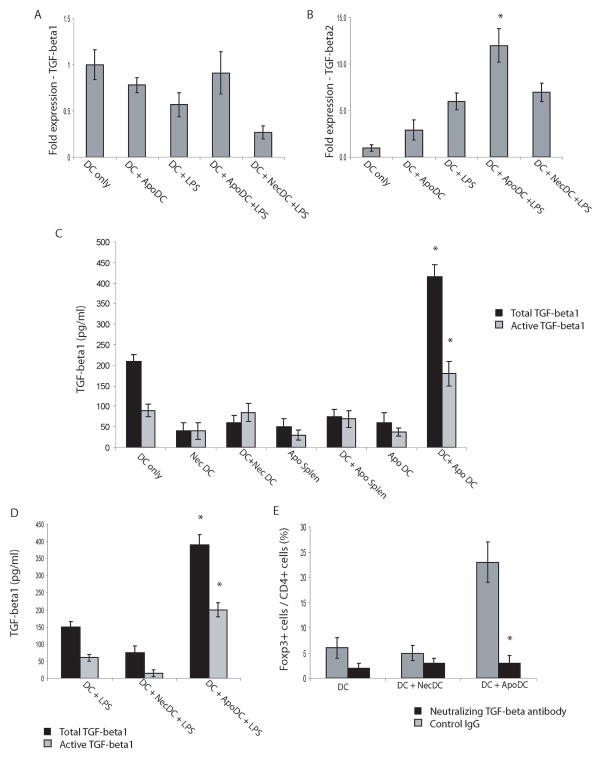
DC apoptosis has been observed in patients with cancer and sepsis, and defects in DC apoptosis have been implicated in the development of autoimmune diseases. However, the mechanisms of how DC apoptosis affects immune responses, are unclear. In this study, we showed that immature viable DC have the ability to uptake apoptotic DC as well as necrotic DC without it being recognized as an inflammatory event by immature viable DC. However, the specific uptake of apoptotic DC converted immature viable DC into tolerogenic DC, which were resistant to LPS-induced maturation. These tolerogenic DC secreted increased levels of TGF-beta1, which induced differentiation of naïve T cells into Foxp3(+) Treg. Furthermore, induction of Treg differentiation only occurred upon uptake of apoptotic DC and not apoptotic splenocytes by viable DC, indicating that it is specifically the uptake of apoptotic DC that gives viable immature DC the potential to induce Foxp3(+) Treg. Taken together, these findings identify uptake of apoptotic DC by viable immature DC as an immunologically tolerogenic event.


Conflict of interest statement

Conflict of interest: The authors declare no financial or commercial conflict of interest.

Figures

Figure 1
Figure 1
UV radiation induces apoptosis in DC and splenocytes. (A) Detection of apoptotic DC, 1 hr, and 6 hr after UV exposure, by staining with annexin V-FITC, EH and Hoechst 33342. (B) FACS analysis for assessment of late and apoptotic DC by staining with annexin V-FITC and PI. (C) Splenocytes were UV-irradiated and FACS analysis was conducted for assessment of apoptotic splenocytes by staining with annexin V-FITC and PI. Data are representative of 4–5 independent experiments.
Figure 2
Figure 2
Viable DC uptake apoptotic DC in vitro and this uptake is inhibited by cytochalasin D. CFSE-labelled apoptotic DC were incubated with viable immature DC with or without cytochalasin D at a ratio of 10:1 and 8 hours later, FACS analyses were conducted to assess uptake of CFSE+ apoptotic DC by viable DC. Viable DC were gated based on PI-exclusion (see gate in top panel) and the proportion of CFSE+ cells was assessed among PI viable DC (middle panel). DC phenotype is confirmed by staining with CD11c and MHC class II (bottom panel). Data are representative of 3 independent experiments.
Figure 3
Figure 3
Immature/mature apoptotic DC or necrotic DC do not induce maturation of viable DC. Viable immature DC were incubated with immature apoptotic DC, mature apoptotic DC, LPS or necrotic DC and 24 hours later FACS analysis was performed to assess expression of CD86, CD80, MHC II on PI CD11c+ viable DC (A) along with the proportion of IL-12+ cells among CD11c+ DC (B). Data are representative of 3 independent experiments, with n=3–4 for every experiment.
Figure 4
Figure 4
Viable DC fail to upregulate CD86 expression and IL-12 production in response to LPS upon uptake of apoptotic DC. Viable immature DC were cultured as follows: without LPS (DC only), with LPS (DC+LPS), incubated with apoptotic DC and then subsequently cultured with LPS (DC+ApoDC+LPS), incubated with necrotic DC and subsequently cultured with LPS (DC+NecDC+LPS), incubated with apoptotic splenocytes and subsequently cultured with LPS (DC+ApoSplen+LPS). (A) Representative dot plots depicting gating strategy for viable CD11c+ DC and exclude apoptotic/necrotic DC. (B) Comparison of proportion of CD86+CD11c+ DC 24 hours after culture. (C) Representative histograms of CD86 expression on viable CD11c+ DC in response to indicated treatments. (D) Representative histograms of IL-12 production by CD11c+ DC in response to indicated treatments. (E) Comparison of proportion of IL-12+ DC 24 hours after culture. Data show mean ± SD, and are representative of 4–5 independent experiments, with n=3–4 in every experiment.*p<0.05, DC+ApoDC+LPS vs. all other groups except DC only. #p<0.05, DC+ApoSplen+LPS vs. all other groups.
Figure 5
Figure 5
Viable DC become tolerogenic DC upon uptake of apoptotic DC. Viable DC were cultured as follows: without LPS (DC only), with LPS (DC+LPS), incubated with apoptotic DC and then subsequently with LPS (DC+ApoDC+LPS), or incubated with necrotic DC and subsequently cultured with LPS (DC+NecDC+LPS). Real-time RT-PCR analysis to look at expression levels of IL-1β (A), IL-6 (B), TNF-α (C), IL-12p35 (D), and IL-12p40 (E). Results show relative expression of different cytokines normalized to expression levels in viable immature DC without any treatment (DC only). (F) Naïve CD4+CD25 T cells isolated from OT-II mice were cultured with viable DC (DC- No OVA), viable DC pulsed with OVA (DC - OVA), viable DC incubated with apoptotic DC and then pulsed with OVA (DC+ApoDC – OVA) or viable DC incubated with necrotic DC and then pulsed with OVA (DC + NecDC –OVA). 3 days later, proliferation was assessed via BrdU incorporation assay. Data show mean ± SD, obtained from 4–5 independent experiments, with n=2–3 in every experiment.*p<0.05, DC+ApoDC+LPS vs all other groups except DC only for D–E, DC+Apo-OVA vs. all other groups except DC-No OVA for F. #p<0.05, DC+ApoDC+LPS vs. all other groups for A–C.
Figure 6
Figure 6
Viable DC take up apoptotic DC and induce differentiation of naïve T cells into Foxp3+ Treg in vitro. Naïve OT-II CD4+CD25 T cells were cultured with the following: live DC pulsed with OVA (Live DC), necrotic DC (NecDC), live DC incubated with necrotic DC and then pulsed with OVA (Live + NecDC), apoptotic splenocytes (ApoSplen), live DC incubated with apoptotic splenocytes and then pulsed with OVA (Live + ApoSplen), apoptotic DC (ApoDC), or live DC incubated with apoptotic DC and then pulsed with OVA (Live + Apo DC). Five days later, T cells were analyzed for Foxp3 expression. (A) Representative dot plots of CD4+Foxp3+ Treg in OT-II T cells cultured with DC under various conditions. (B) Histogram comparing percentages of Treg. Percentages are normalized to total CD4+ T cells in the culture. (C) 5 days after culture, CD4+CD25hi T cells were isolated from the co-culture and were added to a co-culture of naïve OT-II CD4+ T cells and OVA-pulsed DC at different ratios. 4 days later, cell proliferation was assessed by BrdU incorporation assay and data are presented as % suppression of T cell proliferation compared to that of OT-II CD4+ T cells cultured in the presence of OVA-pulsed DC without addition of any CD4+CD25hi T cells. (D–E) Naïve wild-type CD4+CD25 T cells were cultured for 5 days with plate-bound anti-CD3 Ab and soluble anti-CD28 Ab, under a transwell containing treatments as described above without pulsing live DC with OVA. 5 days later, FACS analysis was performed to assess percentages of CD4+ Foxp3+ Treg. (D) Representative histogram of Foxp3 on CD4+ T cells cultured under a transwell containing Live DC or Live+ApoDC. (E) Comparison of % Treg induced as a proportion of CD4+ T cells. (F) Naïve CD4+CD25 T cells were cultured under Th17 inducing conditions in presence of indicated treatments. Representative histogram of the proportion of IL-17+ cells after 4 days of culture. Data show mean ± SD and are representative of 4 independent experiments, with n=3 for each experiment.*p<0.05 for Live+ApoDC vs. all the other groups.
Figure 7
Figure 7
In response to LPS, viable DC that have taken up apoptotic DC, induce secretion of TGF-β1 and upregulate TGF-β2 gene expression, which mediates generation of Foxp3+ Treg. (A–B) Real-time RT-PCR analysis was conducted to detect expression levels of TGF-β1 (A) and TGF-β2 (B) from cultured DC with the following treatments: no LPS (DC only), incubation with apoptotic DC with no LPS (DC+ApoDC), LPS (DC+LPS), incubation with apoptotic DC followed by culturing in the presence of LPS (DC+ApoDC+LPS) or incubation with necrotic DC followed by culturing in the presence of LPS (DC +NecDC +LPS). (C) Concentration of total TGF-β1 and active TGF-β1 released into medium by viable DC (DC only), necrotic DC (NecDC), viable DC incubated with necrotic DC (DC + NecDC), apoptotic splenocytes (ApoSplen), viable DC incubated with apoptotic splenocytes (DC + ApoSplen), apoptotic DC (ApoDC), or viable DC incubated with apoptotic DC (DC + ApoDC). (D) Concentration of total TGF-β1 and active TGF-β1 released into the media by: viable DC cultured in the presence of LPS (DC + LPS), viable DC incubated with necrotic DC and then cultured in the presence of LPS (DC + NecDC + LPS) or viable DC incubated with apoptotic DC and then cultured in the presence of LPS (DC + ApoDC + LPS). (E) Naïve CD4+CD25 T cells, isolated from spleens of OT-II mice, were cultured with the following: live DC pulsed with OVA (DC), live DC incubated with necrotic DC and then pulsed with OVA (DC + NecDC), or live DC incubated with apoptotic DC and then pulsed with OVA (DC + ApoDC). Furthermore, TGF-β neutralizing antibody or a control antibody was added to the culture. Five days later, T cells were analyzed for Foxp3 expression. Data show mean ± SD, obtained and pooled from 4 independent experiments, n=2–3 for each experiment. *p<0.05, DC+ApoDC+LPS vs. all other groups for B, DC+ApoDC vs. all other groups for total TGF-β1 or active TGF-β1 levels for C, DC+ApoDC+LPS vs. all other groups for total TGF-β1 or active TGF-β1 levels for D, DC + ApoDC with control antibody versus DC + ApoDC with neutralizing TGF-β antibody for E.
Figure 8
Figure 8
mTOR pathway is involved in induction of TGF-β1secretion upon uptake of apoptotic DC by viable DC. (A) Total and active TGF-β1 levels released in the media upon uptake of apoptotic DC by live DC in the absence/presence of rapamycin. (B) Total and active TGF-β1 levels released in the media in response to LPS stimulation upon uptake of apoptotic DC by live DC in the presence/absence of rapamycin. Data show mean ± SD, representative of 3 independent experiments. *p<0.05, rapamycin treated groups vs. untreated groups.

References

    1. Steinman RM, Hawiger D, Nussenzweig MC. Tolerogenic dendritic cells. Annu Rev Immunol. 2003;21:685–711. - PubMed
    1. Huang FP, Platt N, Wykes M, Major JR, Powell TJ, Jenkins CD, MacPherson GG. A discrete subpopulation of dendritic cells transports apoptotic intestinal epithelial cells to T cell areas of mesenteric lymph nodes. J Exp Med. 2000;191:435–444. - PMC - PubMed
    1. Sauter B, Albert ML, Francisco L, Larsson M, Somersan S, Bhardwaj N. Consequences of cell death: exposure to necrotic tumor cells, but not primary tissue cells or apoptotic cells, induces the maturation of immunostimulatory dendritic cells. J Exp Med. 2000;191:423–434. - PMC - PubMed
    1. Peng Y, Martin DA, Kenkel J, Zhang K, Ogden CA, Elkon KB. Innate and adaptive immune response to apoptotic cells. J Autoimmun. 2007;29:303–309. - PMC - PubMed
    1. Winau F, Weber S, Sad S, de Diego J, Hoops SL, Breiden B, Sandhoff K, Brinkmann V, Kaufmann SH, Schaible UE. Apoptotic vesicles crossprime CD8 T cells and protect against tuberculosis. Immunity. 2006;24:105–117. - PubMed

Publication types

MeSH terms

Grants and funding

LinkOut - more resources