Current and future climate- and air pollution-mediated impacts on human health
- PMID: 20102593
- PMCID: PMC2796504
- DOI: 10.1186/1476-069X-8-S1-S8
Current and future climate- and air pollution-mediated impacts on human health
Abstract
Background: We describe a project to quantify the burden of heat and ozone on mortality in the UK, both for the present-day and under future emission scenarios.
Methods: Mortality burdens attributable to heat and ozone exposure are estimated by combination of climate-chemistry modelling and epidemiological risk assessment. Weather forecasting models (WRF) are used to simulate the driving meteorology for the EMEP4UK chemistry transport model at 5 km by 5 km horizontal resolution across the UK; the coupled WRF-EMEP4UK model is used to simulate daily surface temperature and ozone concentrations for the years 2003, 2005 and 2006, and for future emission scenarios. The outputs of these models are combined with evidence on the ozone-mortality and heat-mortality relationships derived from epidemiological analyses (time series regressions) of daily mortality in 15 UK conurbations, 1993-2003, to quantify present-day health burdens.
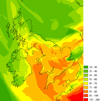
Results: During the August 2003 heatwave period, elevated ozone concentrations > 200 microg m-3 were measured at sites in London and elsewhere. This and other ozone photochemical episodes cause breaches of the UK air quality objective for ozone. Simulations performed with WRF-EMEP4UK reproduce the August 2003 heatwave temperatures and ozone concentrations. There remains day-to-day variability in the high ozone concentrations during the heatwave period, which on some days may be explained by ozone import from the European continent.Preliminary calculations using extended time series of spatially-resolved WRF-EMEP4UK model output suggest that in the summers (May to September) of 2003, 2005 & 2006 over 6000 deaths were attributable to ozone and around 5000 to heat in England and Wales. The regional variation in these deaths appears greater for heat-related than for ozone-related burdens.Changes in UK health burdens due to a range of future emission scenarios will be quantified. These future emissions scenarios span a range of possible futures from assuming current air quality legislation is fully implemented, to a more optimistic case with maximum feasible reductions, through to a more pessimistic case with continued strong economic growth and minimal implementation of air quality legislation.
Conclusion: Elevated surface ozone concentrations during the 2003 heatwave period led to exceedences of the current UK air quality objective standards. A coupled climate-chemistry model is able to reproduce these temperature and ozone extremes. By combining model simulations of surface temperature and ozone with ozone-heat-mortality relationships derived from an epidemiological regression model, we estimate present-day and future health burdens across the UK. Future air quality legislation may need to consider the risk of increases in future heatwaves.
Figures


Similar articles
-
Health burdens of surface ozone in the UK for a range of future scenarios.Environ Int. 2013 Nov;61:36-44. doi: 10.1016/j.envint.2013.09.010. Epub 2013 Oct 3. Environ Int. 2013. PMID: 24096040
-
Air-quality-related health impacts from climate change and from adaptation of cooling demand for buildings in the eastern United States: An interdisciplinary modeling study.PLoS Med. 2018 Jul 3;15(7):e1002599. doi: 10.1371/journal.pmed.1002599. eCollection 2018 Jul. PLoS Med. 2018. PMID: 29969461 Free PMC article.
-
Climate change impacts on human health over Europe through its effect on air quality.Environ Health. 2017 Dec 5;16(Suppl 1):118. doi: 10.1186/s12940-017-0325-2. Environ Health. 2017. PMID: 29219103 Free PMC article. Review.
-
Exposure to Concurrent Heatwaves and Ozone Pollution and Associations with Mortality Risk: A Nationwide Study in China.Environ Health Perspect. 2024 Apr;132(4):47012. doi: 10.1289/EHP13790. Epub 2024 Apr 25. Environ Health Perspect. 2024. PMID: 38662525 Free PMC article.
-
Air quality and climate connections.J Air Waste Manag Assoc. 2015 Jun;65(6):645-85. doi: 10.1080/10962247.2015.1040526. J Air Waste Manag Assoc. 2015. PMID: 25976481 Review.
Cited by
-
Quantifying the health impacts of air pollution under a changing climate-a review of approaches and methodology.Int J Biometeorol. 2014 Mar;58(2):149-60. doi: 10.1007/s00484-012-0625-8. Epub 2013 Jan 25. Int J Biometeorol. 2014. PMID: 23354423 Free PMC article. Review.
-
The Utility of Ambulance Dispatch Call Syndromic Surveillance for Detecting and Assessing the Health Impact of Extreme Weather Events in England.Int J Environ Res Public Health. 2022 Mar 24;19(7):3876. doi: 10.3390/ijerph19073876. Int J Environ Res Public Health. 2022. PMID: 35409559 Free PMC article.
-
Air pollution: impact and prevention.Respirology. 2012 Oct;17(7):1031-8. doi: 10.1111/j.1440-1843.2012.02213.x. Respirology. 2012. PMID: 22726103 Free PMC article. Review.
-
Pollution and its impact on wild animals: a meta-analysis on oxidative stress.Ecohealth. 2010 Sep;7(3):342-50. doi: 10.1007/s10393-010-0345-7. Epub 2010 Sep 24. Ecohealth. 2010. PMID: 20865439
-
Impact of climate change on ambient ozone level and mortality in southeastern United States.Int J Environ Res Public Health. 2010 Jul;7(7):2866-80. doi: 10.3390/ijerph7072866. Epub 2010 Jul 14. Int J Environ Res Public Health. 2010. PMID: 20717546 Free PMC article.
References
-
- EEA, Environment and Health. European Environment Agency report no 10/2005. 2005.
-
- WHO. Health aspects of air pollution with particulate matter, ozone and nitrogen dioxide. Report on a WHO working group, EUR/03/5042688, Bonn. 2003.
-
- Jonson JE, D Simpson H, Solberg S. Can we explain the trends in European ozone levels? Atmos Chem Phys. 2006;6:51–66.
Publication types
MeSH terms
Substances
Grants and funding
LinkOut - more resources
Full Text Sources
Medical
Molecular Biology Databases

