. 2010 Jan 26:6:6.
doi: 10.1186/1744-8069-6-6.

KATP channel subunits in rat dorsal root ganglia: alterations by painful axotomy

Affiliations

KATP channel subunits in rat dorsal root ganglia: alterations by painful axotomy

Vasiliki Zoga et al. Mol Pain. .

Abstract

Background: ATP-sensitive potassium (KATP) channels in neurons mediate neuroprotection, they regulate membrane excitability, and they control neurotransmitter release. Because loss of DRG neuronal KATP currents is involved in the pathophysiology of pain after peripheral nerve injury, we characterized the distribution of the KATP channel subunits in rat DRG, and determined their alterations by painful axotomy using RT-PCR, immunohistochemistry and electron microscopy.

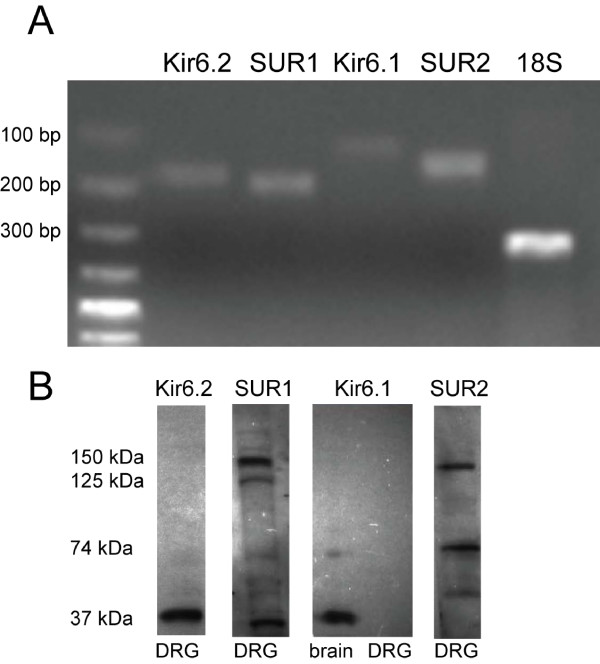
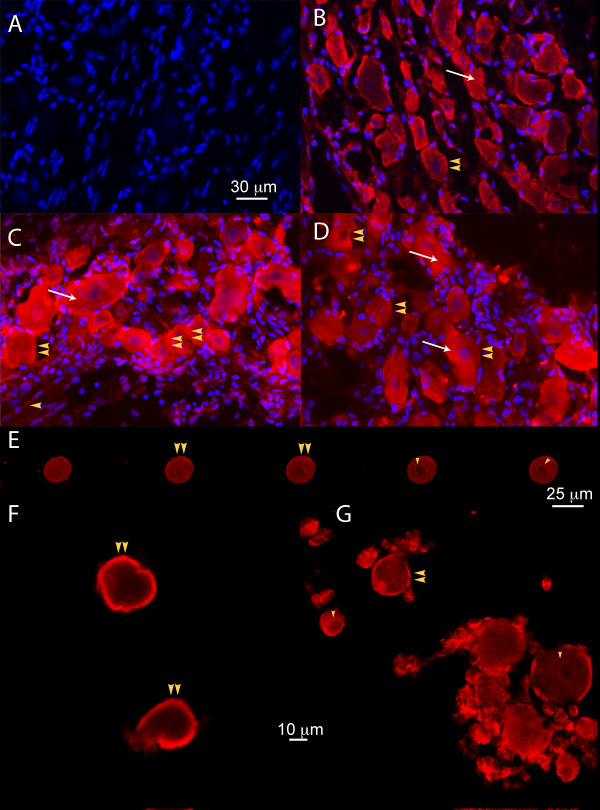
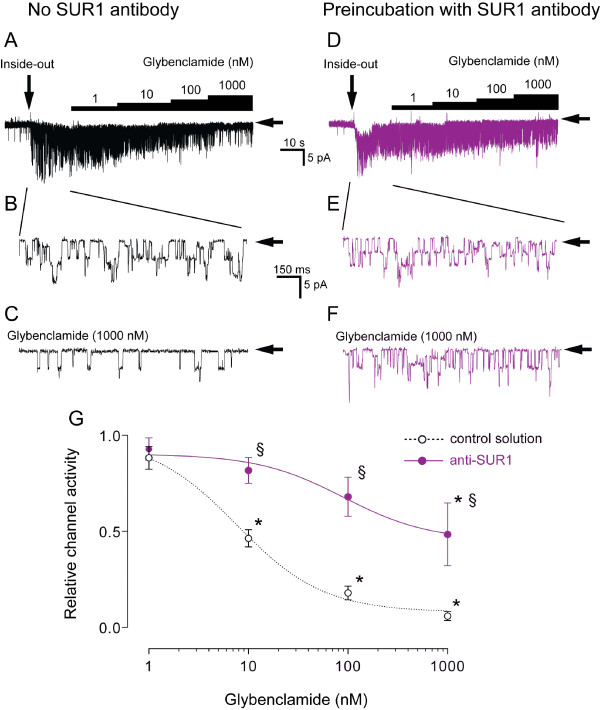
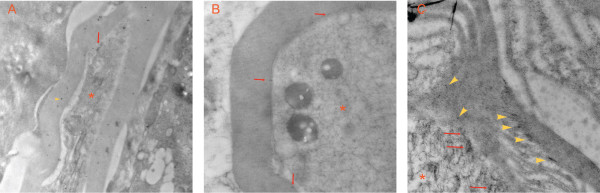
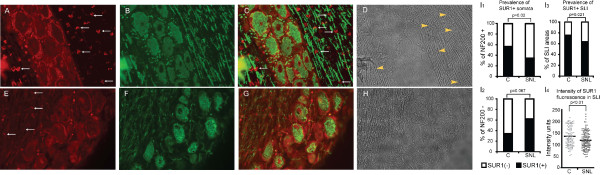
Results: PCR demonstrated Kir6.1, Kir6.2, SUR1 and SUR2 transcripts in control DRG neurons. Protein expression for all but Kir6.1 was confirmed by Western blots and immunohistochemistry. Immunostaining of these subunits was identified by fluorescent and confocal microscopy in plasmalemmal and nuclear membranes, in the cytosol, along the peripheral fibers, and in satellite glial cells. Kir6.2 co-localized with SUR1 subunits. Kir6.2, SUR1, and SUR2 subunits were identified in neuronal subpopulations, categorized by positive or negative NF200 or CGRP staining. KATP current recorded in excised patches was blocked by glybenclamide, but preincubation with antibody against SUR1 abolished this blocking effect of glybenclamide, confirming that the antibody targets the SUR1 protein in the neuronal plasmalemmal membrane. In the myelinated nerve fibers we observed anti-SUR1 immunostaining in regularly spaced funneled-shaped structures. These structures were identified by electron microscopy as Schmidt-Lanterman incisures (SLI) formed by the Schwann cells. Immunostaining against SUR1 and Kir6.2 colocalized with anti-Caspr at paranodal sites.DRG excised from rats made hyperalgesic by spinal nerve ligation exhibited similar staining against Kir6.2, SUR1 or SUR2 as DRG from controls, but showed decreased prevalence of SUR1 immunofluorescent NF200 positive neurons. In DRG and dorsal roots proximal to axotomy SLI were smaller and showed decreased SUR1 immunofluorescence.

Conclusions: We identified Kir6.2/SUR1 and Kir6.2/SUR2 KATP channels in rat DRG neuronal somata, peripheral nerve fibers, and glial satellite and Schwann cells, in both normal state and after painful nerve injury. This is the first report of KATP channels in paranodal sites adjacent to nodes of Ranvier and in the SLI of the Schwann cells. After painful axotomy KATP channels are downregulated in large, myelinated somata and also in SLI, which are also of smaller size compared to controls.Because KATP channels may have diverse functional roles in neurons and glia, further studies are needed to explore the potential of KATP channels as targets of therapies against neuropathic pain and neurodegeneration.


Figures

Figure 1
Figure 1
Expression of KATP channel subunits in DRG at the mRNA and protein level. A. RT-PCR product bands consistent with the presence of mRNA encoding KATP channel subunits in DRG from control rats. Total mRNA was isolated from the L5 DRG. Amplified products appeared at positions corresponding to the expected base pair lengths of 168 (Kir6.2), 182 (SUR1), 110 (Kir6.1), 124 (SUR2) and 315 (18S). B. Western blotting using antibodies against KATP channel subunits in DRG of control rats. Kir6.2 antibody recognized one immunoreactive band at 37 kDa. SUR1 antibody revealed prominent immunoreactive bands at 150 and 37 kDa, and a less pronounced band at 125 kDa. The band at 150 kDa indicates glycosylated SUR1 bound to Kir6.2. Kir6.1 did not detect any band in DRG tissue, while a band of 37 kDa was detected in samples of brain tissue. Two immunoreactive bands at 150 and 74 kDa were detected by SUR2 antibody. Molecular size markers are shown on the left.
Figure 2
Figure 2
Presence and distribution of Kir6.2, SUR1, and SUR2 subunits in DRG neurons and satellite glial cells from control rats. Samples of DRG slices were co-labeled with DAPI, which stains nuclei (blue), and the antibody against each individual subunit (red) (A-D). A. Kir6.1 immunofluorescence was absent in DRG. In contrast the same antibody revealed immunostaining in positive controls (rat brain and aorta smooth muscle; not shown). B. Immunofluorescence against Kir6.2 is identified on plasma membranes (yellow arrowheads) and cytosol (white arrow). Most satellite glial cells also stained positive for Kir6.2. C. Immunofluorescence against SUR1 is observed in the plasma (yellow arrowheads) and nuclear membranes (purple color), as well as along the axons (single yellow arrowhead). Satellite glial cells also stained positive. D. Staining against the SUR2 subunit is observed in the plasma membrane (yellow arrowheads), nuclear membrane (purple color), and the cytosol (white arrow). Satellite glial cells also stained positive. In order to confirm the localization of staining in the plasmalemmal membrane of neurons versus the satellite cell membrane, we examined dissociated DRG cells, stained with the same antibodies, using confocal microscopy. These images clearly showed that neuronal plasmalemmal membrane stained positive for SUR1 (E), Kir6.2 (F), and SUR2 (G). Nuclear envelops also stained positive (E and G, single yellow arrowhead). Distinct positive staining was also observed in satellite cells (G). In E, images correspond to 5 sequential confocal images of z-projections (with spacing increments of 1 μm).
Figure 3
Figure 3
Preincubation with anti-SUR1 antibody abolishes the blocking effect of glybenclamide on single KATP channel opening in excised membrane patches. Neurons preincubated with anti-SUR1 antibody (n = 5, D, E, F; purple) were compared to neurons preincubated in antibody-free solution (n = 7, A, B, C). Horizontal arrows indicate closed channel. A. Representative trace of KATP channel activity in patch excised from a neuron preincubated in antibody-free solution. In these neurons glybenclamide inhibited channel activity in a concentration-dependent fashion. B. Marked channel activity occurred upon excision of patch (vertical arrow in A) into an ATP-free solution. C. Glybenclamide 1000 nM blocked channel activity under control conditions. D. Representative trace of KATP channel activity in patch excised from a neuron preincubated with anti-SUR1 antibody. E. Excision of patch (vertical arrow in D) into an ATP-free external solution also activated channel. Cell-free patch exhibited similar KATP single channel activity as in controls (B). F. In contrast to neurons preincubated in antibody-free solution (C), glybenclamide 1000 nM failed to block channel activity after preincubation with anti-SUR1 antibody. G. Blocking effect of glybenclamide under control conditions is shown in the concentration-response curve (dotted-line; lower trace). Cumulative application of glybenclamide failed to block channel activity after preincubation with anti-SUR1 antibody, as indicated by the less steep concentration-response curve in G (solid line; upper trace). Means ± SD are shown. *:p < 0.05 versus glybenclamide 1 nM; §: p < 0.05 versus control. (Student's t tests were used for intergroup, and Bonferroni tests for intragroup post hoc comparisons).
Figure 4
Figure 4
Colocalization studies in DRG neurons. A-C. Colocalization of BODIPY-Glybenclamide staining of SUR1 subunits (A), with anti-Kir6.2 antibody (B), showing that SUR1 subunits are co-expressed with Kir6.2 subunits in the same complexes (C: merged). D-F. Co-localization of anti-SUR1 antibody (D) with anti-CGRP antibody (E) in DRG studied under fluorescent microscopy. Merged image (F) shows anti-SUR1 immunofluorescence present in small, CGRP positive neurons, as well as in CGRP negative neurons. G-I. Co-localization of anti-SUR1 antibody (G) with anti-CGRP antibody (H) in dissociated neurons studied under confocal microscopy. Merged image (I) shows SUR1 immunofluorescence present in small, CGRP + neurons (arrows), as well as in CGRP negative neurons. K-M. Co-localization of anti-SUR1 antibody (K) with anti-Caspr antibody (L) in DRG studied under confocal microscopy. Merged image (M) shows that SUR1 immunofluorescence co-localizes with anti-Caspr staining in paranodal sites. Yellow arrowheads point to SUR1 positive SLI (in K). N-P. Colocalization of anti-Kir6.2 antibody (N) with anti-Caspr antibody (O) in DRG studied under confocal microscopy. Merged image (P) shows that anti-SUR1 immunofluorescence colocalizes with anti-Caspr staining in paranodal sites, adjacent to Ranvier's nodes (White arrows point at paranodal KATP channels). This colocalization of Caspr with SUR1 or Kir6.2 indicates that KATP channels of the Kir6.2/SUR1 subtype are present in paranodal sites (white arrows) adjacent to nodes of Ranvier. All samples are from slices within DRG tissue.
Figure 5
Figure 5
Distribution of KATP subunits on DRG examined by electron microscopy. Samples from slices within DRG tissue were treated with antibodies against Kir6.2 or SUR1, which were labeled with gold particles (shown as black dots). A. Anti-Kir6.2 staining on axonal membrane (red arrow) and myelin sheath (yellow arrowhead). B. Anti-SUR1 staining on axonal membrane (red arrows). C. Anti-SUR1 staining on axonal membrane (red arrows) and into a SLI (yellow arrowheads). The axons are marked by red asterisks.
Figure 6
Figure 6
Distribution of anti-SUR1 immunofluorescence in the subpopulations of NF200+ and NF200- neurons in control (A-D) and SNL (E-H) DRG. A, E: Red anti-SUR1 immunofluorescence is observed on plasma and nuclear membranes, satellite glial cells, and along the peripheral nerve fibers. White arrows point to SLI. These are more intense and funnel shaped in controls (A) compared to SNL (E), wherein SLI loose their characteristic funnel shape, and appear less intense, thin and disorganized. B,F. Anti-NF 200 staining (green), distinguishes two DRG neuronal subpopulations, corresponding to larger, myelinated NF200+ and to smaller, non-myelinated NF200- fibers. C,G. Merged images showing the difference in distribution of SUR1 staining in each neuronal subgroup between SS and SNL DRG. SLI are shown with arrows in C. D, H: Bright field images. SLI are shown by yellow arrowheads in D. I(1-4). Bargraphs showing the differences in the prevalence of SUR1+ staining between control (C) and SNL NF200+ (I1) and between control (C) and SNL NF200- neuronal somata (I2), compared by Fisher's exact tests. I3. Bargraphs showing the decreased prevalence of SUR1+ SLI between control (C) and SNL axons, compared by Fisher's exact test. I4. Scatterplots showing the difference in the intensity of SUR1 immunofluorescence in SLI between axons from SNL versus control DRG. Arbitrary fluorescence units are used. Comparisons were made by Student's t test.
Figure 7
Figure 7
Differences in SLI between control (A,C,E) and SNL (B,D,F) axons examined by fluorescent and electron microscopy. A. SLI in control DRG. The characteristic funnel-shaped appearance is shown by white arrows. B. Following SNL, SLI proximal to axotomy appear disorganized, without the characteristic immunofluorescent funnel shape (as in A). Intensity of fluorescence in SLI is lower compared to controls. C, E. Control DRG samples examined by EM. SLI are shown between yellow arrowheads. D, F. The areas of SLI (also shown between yellow arrowheads) are decreased proximal to axotomy following SNL, as also presented in details in Table 1. Axons are marked by red asterisks.

Similar articles

Cited by

References

    1. Aguilar-Bryan L, Bryan J. Molecular biology of adenosine triphosphate-sensitive potassium channels. Endocr Rev. 1999;20:101–135. doi: 10.1210/er.20.2.101. - DOI - PubMed
    1. Seino S. ATP-sensitive potassium channels: a model of heteromultimeric potassium channel/receptor assemblies. Annu Rev Physiol. 1999;61:337–362. doi: 10.1146/annurev.physiol.61.1.337. - DOI - PubMed
    1. Miki T, Seino S. Roles of KATP channels as metabolic sensors in acute metabolic changes. J Mol Cell Cardiol. 2005;38:917–925. doi: 10.1016/j.yjmcc.2004.11.019. - DOI - PubMed
    1. Nichols CG. KATP channels as molecular sensors of cellular metabolism. Nature. 2006;440:470–476. doi: 10.1038/nature04711. - DOI - PubMed
    1. Gross GJ, Fryer RM. Sarcolemmal versus mitochondrial ATP-sensitive K+ channels and myocardial preconditioning. Circ Res. 1999;84:973–979. - PubMed

Publication types

MeSH terms

LinkOut - more resources