. 2010 Jan 26:11:64.
doi: 10.1186/1471-2164-11-64.

Changes in the genomic content of circulating Bordetella pertussis strains isolated from the Netherlands, Sweden, Japan and Australia: adaptive evolution or drift?

Affiliations

Changes in the genomic content of circulating Bordetella pertussis strains isolated from the Netherlands, Sweden, Japan and Australia: adaptive evolution or drift?

Audrey J King et al. BMC Genomics. .

Abstract

Background: Bordetella pertussis is the causative agent of human whooping cough (pertussis) and is particularly severe in infants. Despite worldwide vaccinations, whooping cough remains a public health problem. A significant increase in the incidence of whooping cough has been observed in many countries since the 1990s. Several reasons for the re-emergence of this highly contagious disease have been suggested. A particularly intriguing possibility is based on evidence indicating that pathogen adaptation may play a role in this process. In an attempt to gain insight into the genomic make-up of B. pertussis over the last 60 years, we used an oligonucleotide DNA microarray to compare the genomic contents of a collection of 171 strains of B. pertussis isolates from different countries.

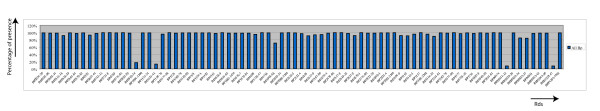
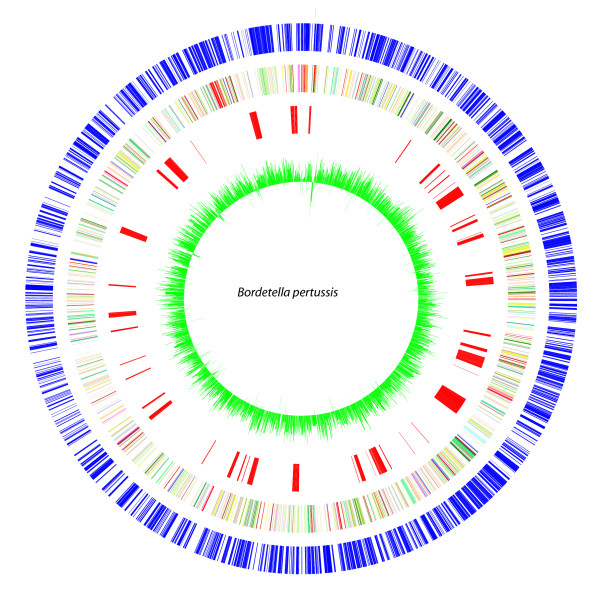
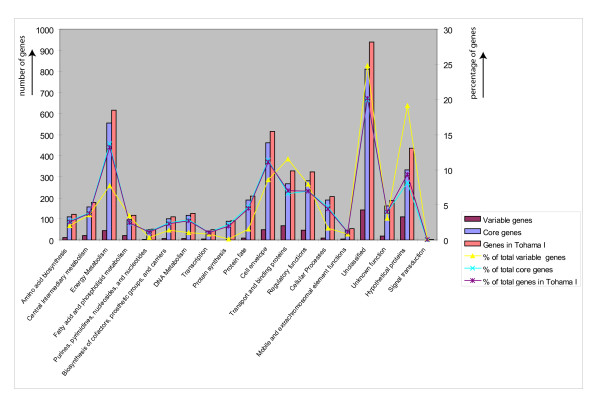
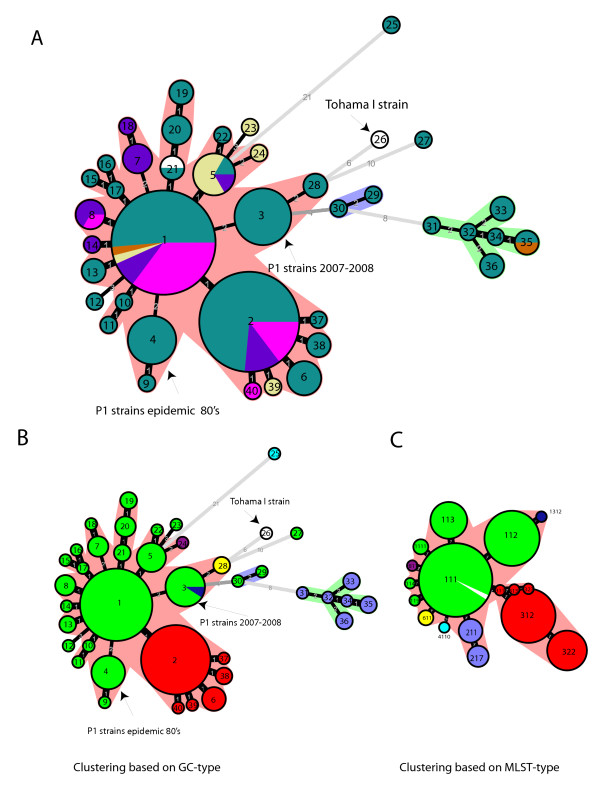
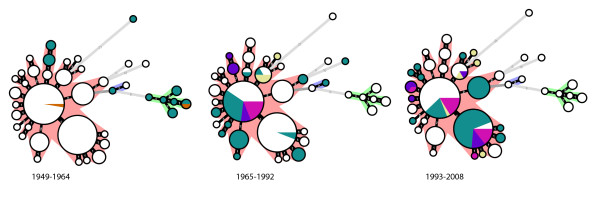
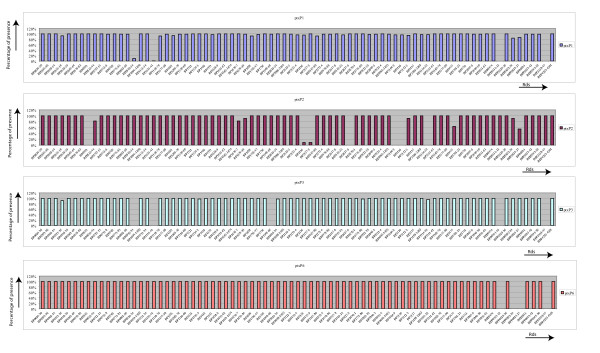
Results: The CGH microarray analysis estimated the core genome of B. pertussis, to consist of 3,281 CDSs that are conserved among all B. pertussis strains, and represent 84.8% of all CDSs found in the 171 B. pertussis strains. A total of 64 regions of difference consisting of one or more contiguous CDSs were identified among the variable genes. CGH data also revealed that the genome size of B. pertussis strains is decreasing progressively over the past 60 years. Phylogenetic analysis of microarray data generated a minimum spanning tree that depicted the phylogenetic structure of the strains. B. pertussis strains with the same gene content were found in several different countries. However, geographic specificity of the B. pertussis strains was not observed. The gene content was determined to highly correlate with the ptxP-type of the strains.

Conclusions: An overview of genomic contents of a large collection of isolates from different countries allowed us to derive a core genome and a phylogenetic structure of B. pertussis. Our results show that B. pertussis is a dynamic organism that continues to evolve.


Figures

Figure 1
Figure 1
The frequency at which regions of difference (RD) are present in B. pertussis clinical strains isolated in 6 different countries between 1949 and 2008. Histogram of the average gene content of all 171 B. pertussis strains analyzed. Bars indicate the presence percentage of the gene or geneclusters (RDs).
Figure 2
Figure 2
The variable genes identified with microarray in this study, mapped onto circular B. pertussis genome Tohama I. Variable genes not present in the Tohama I genome are not mapped in this figure. From the outside in, the outer circle 1 (blue) shows the position of the genes on the + strand. Circle 2 shows the COG functional categories on the + strand. The COG domains are color coded according to their main functional categories (for color code see additional file 8, Table S9). Circle 3 (red) indicates the position of the variable genes on the Tohama I genome. Circle 4 shows the GC % percentage of the Tohama I sequence.
Figure 3
Figure 3
Functional categories of core and variable genes in B. pertussis. The height of each bar represents the number of variable (purple), core (blue) and genes present in Tohama I (orange) indicated in specific gene categories. The lines indicate the percentages of the total, variable genes (yellow), core genes (blue) or genes in Tohama I (purple) in each category.
Figure 4
Figure 4
Minimum spanning tree of 148 B. pertussis strains. A. Each circle (node) represents a different GC-type, indicated by the number in the middle of the circle. The size of the circle corresponds to the number of strains within the particular GC-type. The number along the edge reflects the phylogenic distance between each neighboring node. A thicker edge corresponds to a shorter phylogenic distance. Color is based on country of isolation: Green = Netherlands, Pink = Sweden, Yellow = Japan, Purple = Australia, Brown = Dutch vaccine strains 509 and 134, White = Tohama I strain, Wellcome 28 strain. B. Minimum spanning tree as in Figure 4A, color based on ptxP type. Green = ptxP1, Blue = ptxP2, Red = ptxP3, Turquoise = ptxP4, Yellow = ptxP6, Purple = ptxP8 and Darkblue = ptxP13, White = Tohama I strain. C. Minimum spanning tree based on MLST-types, MLST designation was based on the allele number in the order ptxP, fim3 and prn region 1 (e.g. MLST 113 represents strains with ptxP1, fim3-1 and prn3). Each circle represents a different MLST-type, indicated by the number in the middle of the circle. The number along the edge reflects the phylogenic distance between each neighboring node. A thicker edge corresponds to a shorter phylogenic distance. Color code is as described in Figure 4B.
Figure 5
Figure 5
Gradual change in gene content in B. pertussis strains. Minimum spanning tree as shown in Figure 4A, but only strains isolated in indicated time period are colored. Color code is as described in Figure 4A.
Figure 6
Figure 6
Histogram of the average gene content of strains carrying ptxP1, ptxP2, ptxP3 and ptxP6 types. Bars indicate the presence of the gene or geneclusters in all strains analyzed with a particular ptxP type, ptxP1 (n = 91), ptxP2 (n = 9), ptxP3(n = 39) and ptxP6 (n = 9).
Figure 7
Figure 7
Decrease in genome size in time. Each dot stands for the calculated approximate genome-size of each strain plotted against the isolation year (n = 171). The color of the dots is based on the country of isolation. Strains with the same genome size and isolated in the same isolation year will be visible as one dot.

Similar articles

Cited by

References

    1. Cummings CA, Brinig MM, Lepp PW, van de PS, Relman DA. Bordetella species are distinguished by patterns of substantial gene loss and host adaptation. J Bacteriol. 2004;186:1484–1492. doi: 10.1128/JB.186.5.1484-1492.2004. - DOI - PMC - PubMed
    1. Zee A van der, Mooi F, Van Embden J, Musser J. Molecular evolution and host adaptation of Bordetella spp.: phylogenetic analysis using multilocus enzyme electrophoresis and typing with three insertion sequences. J Bacteriol. 1997;179:6609–6617. - PMC - PubMed
    1. Heininger U, Stehr K, Schmitt-Grohe S, Lorenz C, Rost R, Christenson PD. et al.Clinical characteristics of illness caused by Bordetella parapertussis compared with illness caused by Bordetella pertussis. Pediatr Infect Dis J. 1994;13:306–309. - PubMed
    1. Gueirard P, Weber C, Le Coustumier A, Guiso N. Human Bordetella bronchiseptica infection related to contact with infected animals: persistence of bacteria in host. J Clin Microbiol. 1995;33:2002–2006. - PMC - PubMed
    1. Diavatopoulos DA, Cummings CA, Schouls LM, Brinig MM, Relman DA, Mooi FR. Bordetella pertussis, the causative agent of whooping cough, evolved from a distinct, human-associated lineage of B. bronchiseptica. PLoS Pathog. 2005;1:e45. doi: 10.1371/journal.ppat.0010045. - DOI - PMC - PubMed

Publication types

LinkOut - more resources