. 2010 May;138(5):1976-87.
doi: 10.1053/j.gastro.2010.01.037. Epub 2010 Jan 25.

Dynamic changes in cytosolic and mitochondrial ATP levels in pancreatic acinar cells

Affiliations

Dynamic changes in cytosolic and mitochondrial ATP levels in pancreatic acinar cells

Svetlana G Voronina et al. Gastroenterology. 2010 May.

Abstract

Background & aims: Previous studies of pancreatic acinar cells characterized the effects of Ca(2+)-releasing secretagogues and substances, inducing acute pancreatitis on mitochondrial Ca(2+), transmembrane potential, and NAD(P)H, but dynamic measurements of the crucial intracellular adenosine triphosphate (ATP) levels have not been reported. Here we characterized the effects of these agents on ATP levels in the cytosol and mitochondria.

Methods: ATP levels were monitored using cytosolic- or mitochondrial-targeted luciferases.

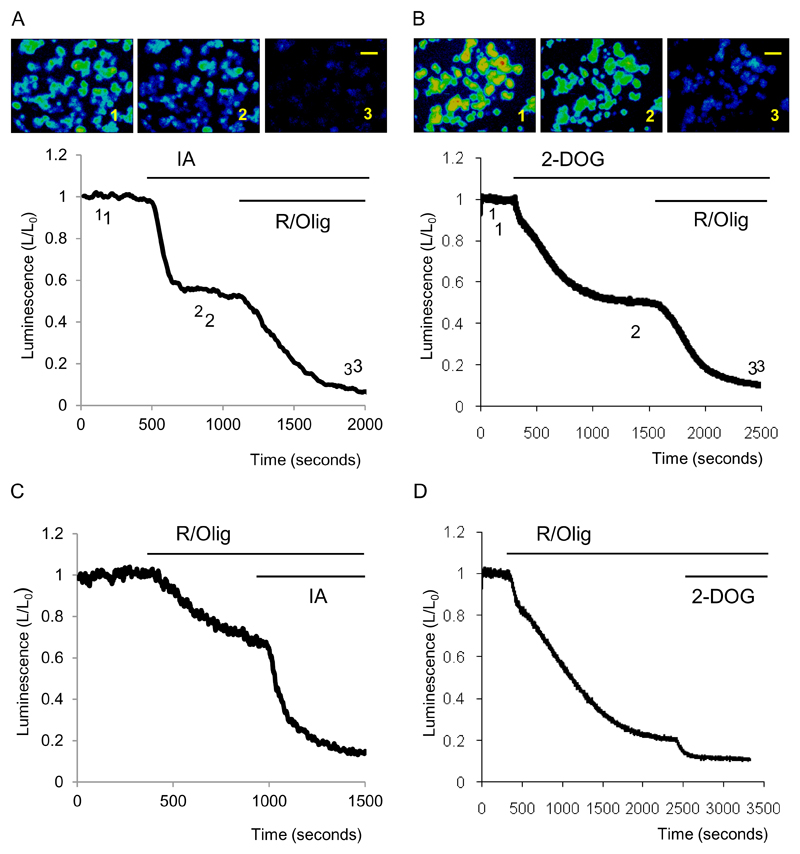
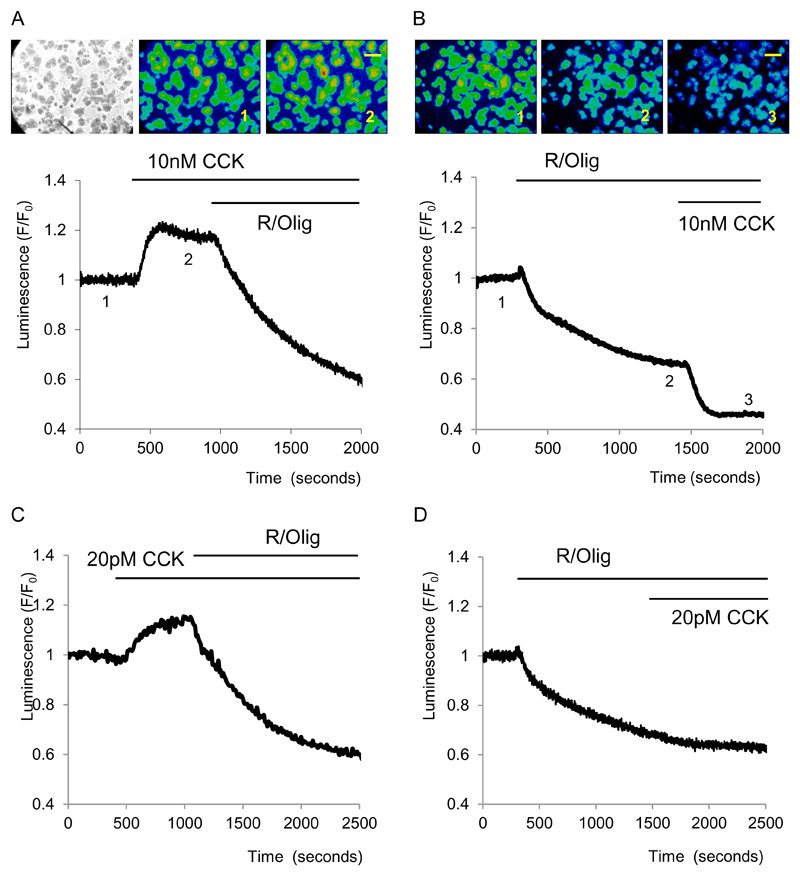
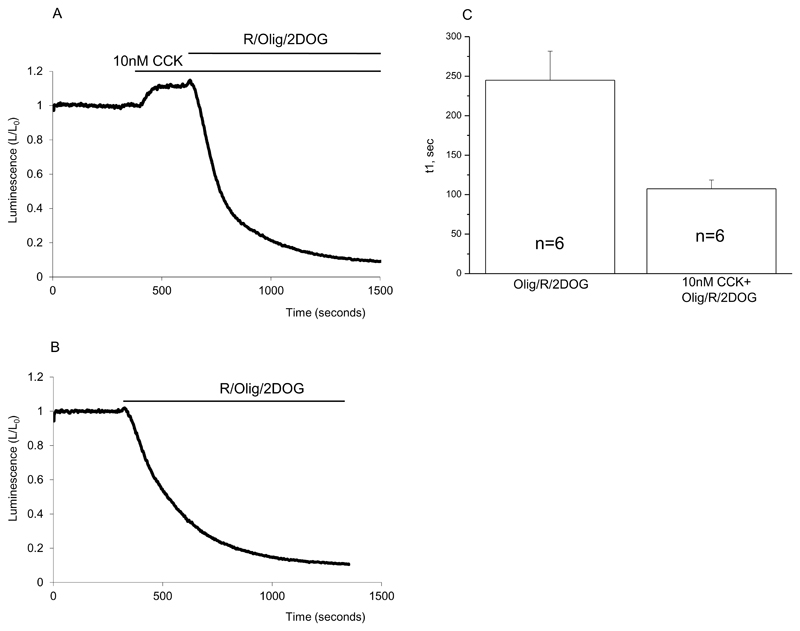
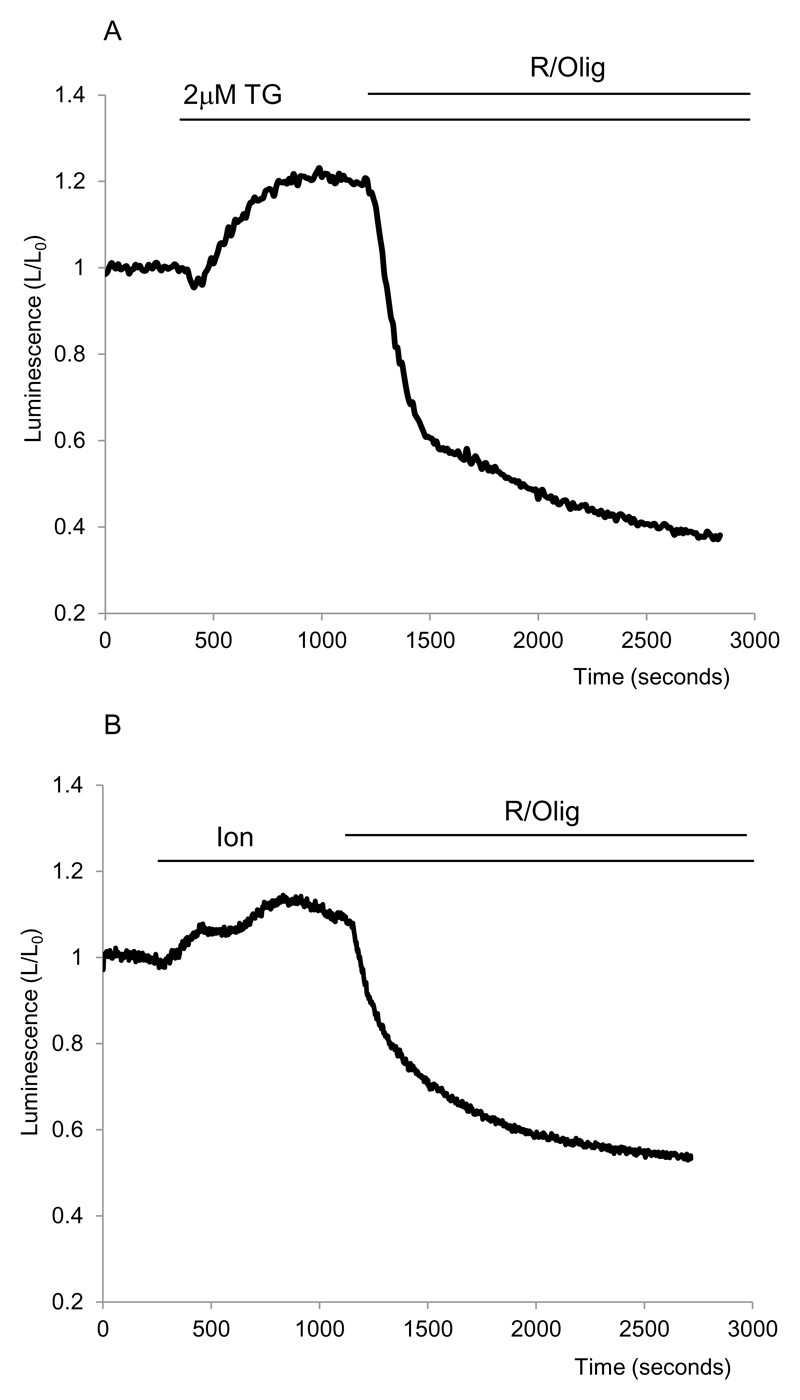
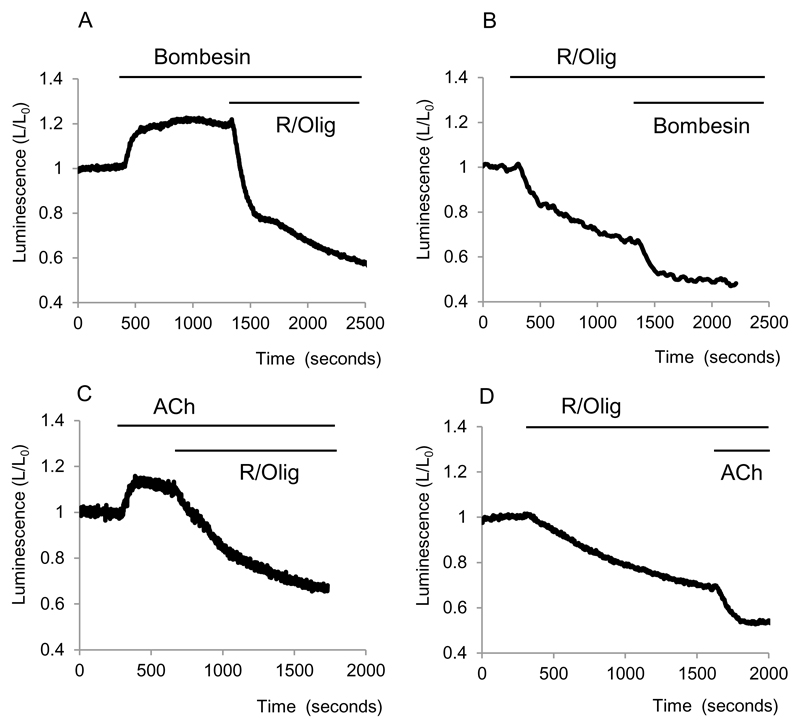
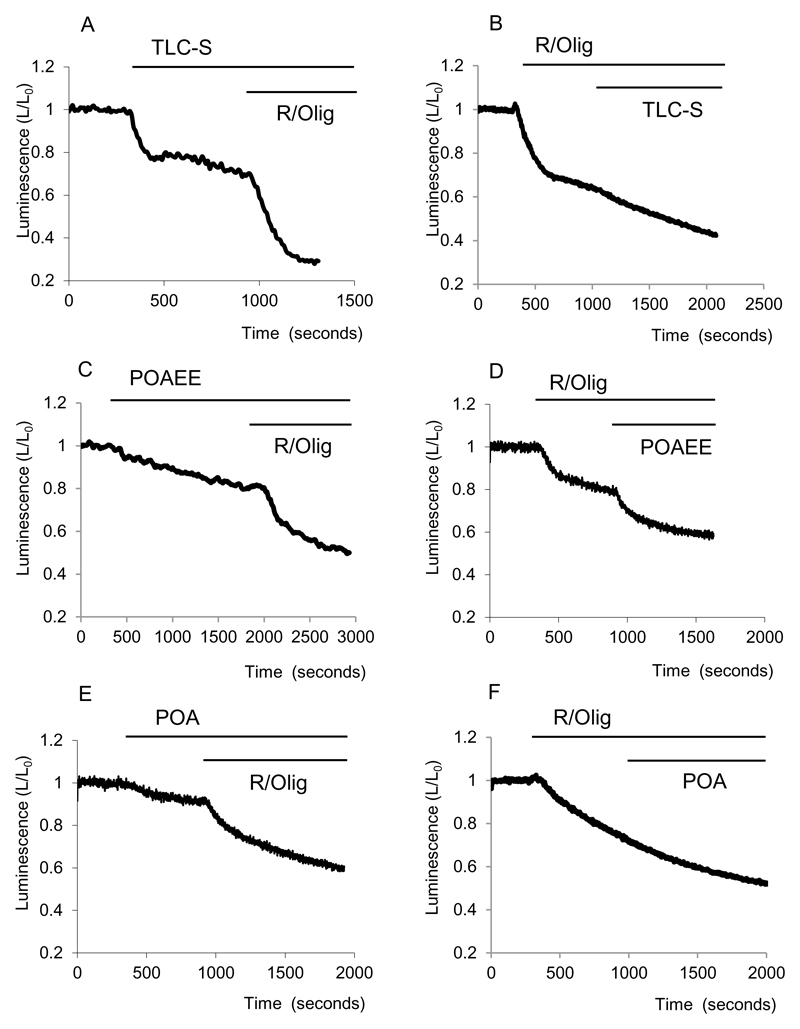
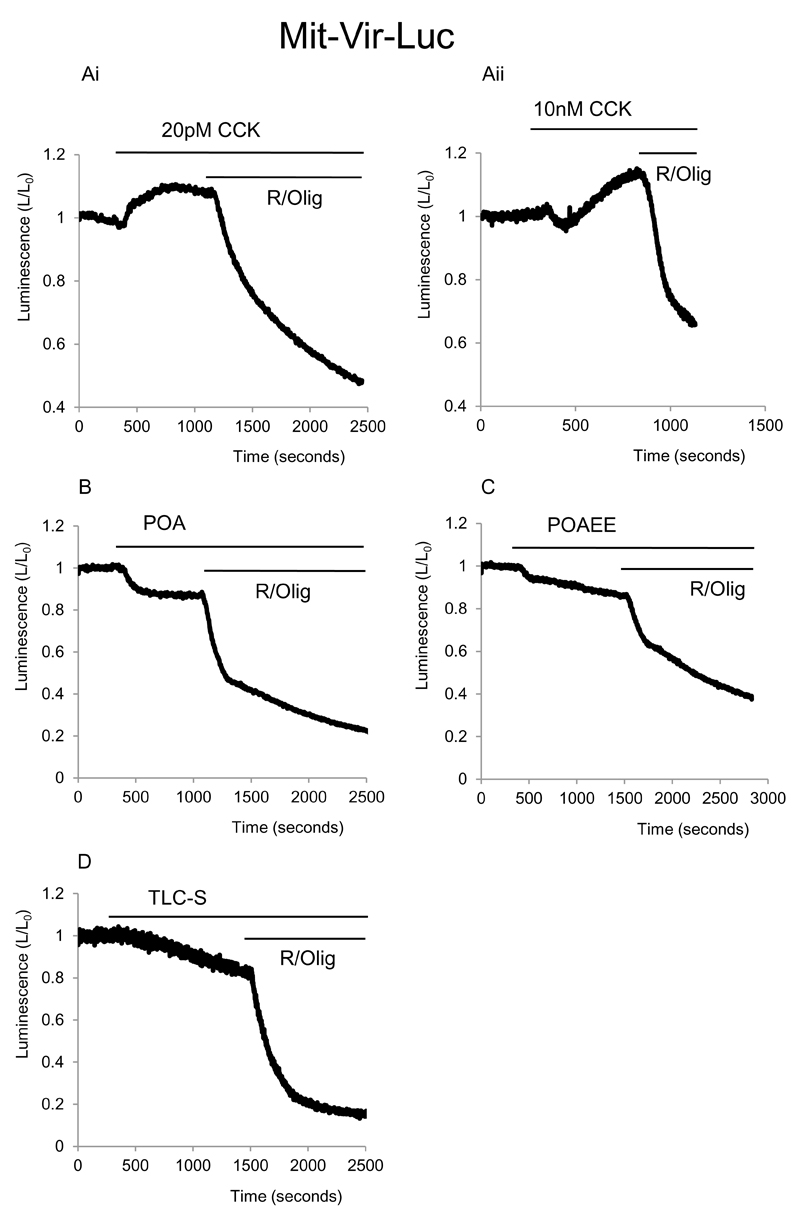
Results: Inhibition of oxidative phosphorylation produced a substantial decrease in cytosolic ATP comparable to that induced by inhibition of glycolysis. Cholecystokinin-8 (CCK) increased cytosolic ATP in spite of accelerating ATP consumption. Acetylcholine, caerulein, and bombesin had similar effect. A bile acid, taurolithocholic acid 3-sulfate (TLC-S); a fatty acid, palmitoleic acid (POA); and palmitoleic acid ethyl ester (POAEE) reduced cytosolic ATP. The ATP decrease in response to these substances was observed in cells with intact or inhibited oxidative phosphorylation. TLC-S, POA, and POAEE reduced mitochondrial ATP, whereas physiological CCK increased mitochondrial ATP. Supramaximal CCK produced a biphasic response composed of a small initial decline followed by a stronger increase.

Conclusions: Both glycolysis and oxidative phosphorylation make substantial contributions to ATP production in acinar cells. Ca(2+)-releasing secretagogues increased ATP level in the cytosol and mitochondria of intact isolated cells. TLC-S, POA, and POAEE reduced cytosolic and mitochondrial ATP. When cells rely on nonoxidative ATP production, secretagogues as well as TLC-S, POA, and POAEE all diminish cytosolic ATP levels.


Figures

Figure 1
Figure 1. Effects of inhibitors of glycolysis and oxidative phosphorylation on the cytosolic ATP level of pancreatic acinar cells.
Bioluminescence was recorded from cells transfected with cLuc. A. Images show bioluminescence of pancreatic acinar cells. The images were acquired at time points indicated on the trace. Scale bar corresponds to 100μm Application of IA resulted in a decrease in bioluminescence. R/Olig produced a further strong decrease in bioluminescence. Experiments were conducted with pyruvate (2mM) and glucose (10mM) present in the extracellular solution. B. The images were acquired at time points indicated on the trace. Application of 2-DOG resulted in a decrease in bioluminescence. Scale bar corresponds to 100μm. R/Olig produced a further strong decrease in bioluminescence. Experiment was conducted with pyruvate (2mM) present in the extracellular solution. Glucose was removed from the extracellular solution just before the beginning of the recording. C. The trace illustrates decreases of bioluminescence induced by sequential application of R/O and IA. Experiment was conducted with pyruvate (2mM) and glucose (10mM) present in the extracellular solution. D. The trace illustrates decreases in bioluminescence induced by the sequential application of R/Olig and IA. Experiment was conducted with pyruvate (2mM) present in the extracellular solution. Glucose was removed from the extracellular solution just before the beginning of the recording.
Figure 2
Figure 2. Effects of CCK on cytosolic ATP level.
Bioluminescence was recorded from cells transfected with cLuc. Extracellular solution contained pyruvate (2mM) and glucose (10mM). A. Increase of bioluminescence in cells stimulated with 10nM CCK. The left panel shows transmitted light image of isolated pancreatic acinar cells and clusters of pancreatic acinar cells. Central and right panels show images of bioluminescence recorded at time points indicated on the trace. Scale bar corresponds to 100μm B. Following inhibition of mitochondrial ATP production with R/Olig, a high concentration of CCK triggers a further decrease in ATP level. Images of bioluminescence were recorded at time points indicated on the trace. Scale bar corresponds to 100μm C. Increase of bioluminescence induced by a low (20pM) concentration of CCK. D. Following inhibition of mitochondrial ATP production with R/Olig a low concentration of CCK does not produce a further decrease in bioluminescence.
Figure 3
Figure 3. CCK increases the rate of cytosolic ATP consumption.
Bioluminescence was recorded from cells transfected with cLuc. A. Bioluminescence changes induced by CCK and subsequent inhibition of both oxidative phosphorylation and glycolysis. B. Bioluminescence changes induced by inhibition of oxidative phosphorylation and glycolysis. C. The decline of bioluminescence in experiments illustrated in A and B was approximated by an exponential function. The averaged time constants for the decline in the presence and absence of CCK are shown as bar graphs (± standard errors, number of experiments indicated on the bars).
Figure 4
Figure 4. Thapsigargin and Ionomycin induce an increase in cytosolic ATP.
Bioluminescence was recorded from cells transfected with cLuc. A. Rise of bioluminescence induced by TG. B. Rise of bioluminescence induced by Ion.
Figure 5
Figure 5. Effects of Bombesin and ACh on cytosolic ATP.
Bioluminescence was recorded from cells transfected with cLuc. A and B show effects of Bombesin on cytosolic bioluminescence in cells with intact and inhibited (by R/Olig) mitochondrial ATP production respectively. C and D show effects of ACh on cytosolic bioluminescence in cells with intact and inhibited (by R/Olig) mitochondrial ATP production respectively.
Figure 6
Figure 6. Effects of TLC-S, POAEE and POA on cytosolic ATP.
Bioluminescence was recorded from cells transfected with cLuc. A and B show effects of TLC-S on cytosolic bioluminescence in cells with intact and inhibited (by R/Olig) mitochondrial ATP production respectively. C and D show effects of POAEE on cytosolic bioluminescence in cells with intact and inhibited (by R/Olig) mitochondrial ATP production respectively. E Illustrates a decrease of bioluminescence induced by POA. F Following inhibition of mitochondrial ATP production by R/Olig we have not observed further changes in bioluminescence upon application of POA.
Figure 7
Figure 7. Effect of CCK, POA, POAEE and TLC-S on mitochondrial ATP level in pancreatic acinar cells.
Bioluminescence was recorded from cells transfected with mLuc. A Effect of different concentrations of CCK on the bioluminescence. A (i) shows changes of bioluminescence induced by 20pM CCK. A (ii) depicts changes of bioluminescence induced by 10nM CCK. Note biphasic response of bioluminescence. At the end of each experiment combination of mitochondrial inhibitors R/Olig was applied, note the abrupt and strong decrease in bioluminescence upon the application of R/Olig in all experiments shown on Fig.7. B Shows the effect of POA on bioluminescence. C Illustrates effect of POAEE on bioluminescence. D Effect of TLC-S on bioluminescence.

References

    1. Ainscow EK, Rutter GA. Mitochondrial priming modifies Ca2+ oscillations and insulin secretion in pancreatic islets. Biochem J. 2001;353:175–180. - PMC - PubMed
    1. Barrow SL, Voronina SG, da S X, Chvanov MA, Longbottom RE, Gerasimenko OV, Petersen OH, Rutter GA, Tepikin AV. ATP depletion inhibits Ca2+ release, influx and extrusion in pancreatic acinar cells but not pathological Ca2+ responses induced by bile. Pflugers Arch. 2008;455:1025–1039. - PubMed
    1. Bauduin H, Colin M, Dumont JE. Energy sources for protein synthesis and enzymatic secretion in rat pancreas in vitro. Biochim Biophys Acta. 1969;174:722–733. - PubMed
    1. Bell CJ, Bright NA, Rutter GA, Griffiths EJ. ATP regulation in adult rat cardiomyocytes: time-resolved decoding of rapid mitochondrial calcium spiking imaged with targeted photoproteins. J Biol Chem. 2006;281:28058–28067. - PubMed
    1. Bell CJ, Manfredi G, Griffiths EJ, Rutter GA. Luciferase expression for ATP imaging: application to cardiac myocytes. Methods Cell Biol. 2007;80:341–352. - PubMed

Publication types

MeSH terms