Metabolism-mediated drug interactions associated with ritonavir-boosted tipranavir in mice
- PMID: 20103582
- PMCID: PMC2872945
- DOI: 10.1124/dmd.109.030817
Metabolism-mediated drug interactions associated with ritonavir-boosted tipranavir in mice
Abstract
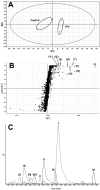
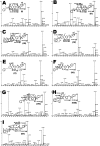
Tipranavir (TPV) is the first nonpeptidic protease inhibitor used for the treatment of drug-resistant HIV infection. Clinically, TPV is coadministered with ritonavir (RTV) to boost blood concentrations and increase therapeutic efficacy. The mechanism of metabolism-mediated drug interactions associated with RTV-boosted TPV is not fully understood. In the current study, TPV metabolism was investigated in mice using a metabolomic approach. TPV and its metabolites were found in the feces of mice but not in the urine. Principal component analysis of the feces metabolome uncovered eight TPV metabolites, including three monohydroxylated, three desaturated, one dealkylated, and one dihydroxylated. In vitro study using human liver microsomes recapitulated five TPV metabolites, all of which were suppressed by RTV. CYP3A4 was identified as the primary enzyme contributing to the formation of four TPV metabolites (metabolites II, IV, V, and VI), including an unusual dealkylated product arising from carbon-carbon bond cleavage. Multiple cytochromes P450 (2C19, 2D6, and 3A4) contributed to the formation of a monohydroxylated metabolite (metabolite III). In vivo, RTV cotreatment significantly inhibited eight TPV metabolic pathways. In summary, metabolomic analysis revealed two known and six novel TPV metabolites in mice, all of which were suppressed by RTV. The current study provides solid evidence that the RTV-mediated boosting of TPV is due to the modulation of P450-dependent metabolism.
Figures


Similar articles
-
Steady-state disposition of the nonpeptidic protease inhibitor tipranavir when coadministered with ritonavir.Antimicrob Agents Chemother. 2007 Jul;51(7):2436-44. doi: 10.1128/AAC.01115-06. Epub 2007 May 7. Antimicrob Agents Chemother. 2007. PMID: 17485497 Free PMC article. Clinical Trial.
-
Timolol metabolism in human liver microsomes is mediated principally by CYP2D6.Drug Metab Dispos. 2007 Jul;35(7):1135-41. doi: 10.1124/dmd.106.012906. Epub 2007 Apr 12. Drug Metab Dispos. 2007. PMID: 17431033
-
In vitro metabolism of the calmodulin antagonist DY-9760e (3-[2-[4-(3-chloro-2-methylphenyl)-1-piperazinyl]ethyl]-5,6-dimethoxy-1-(4-imidazolylmethyl)-1H-indazole dihydrochloride 3.5 hydrate) by human liver microsomes: involvement of cytochromes p450 in atypical kinetics and potential drug interactions.Drug Metab Dispos. 2005 Nov;33(11):1628-36. doi: 10.1124/dmd.105.004903. Epub 2005 Jul 27. Drug Metab Dispos. 2005. PMID: 16049129
-
Tipranavir: a protease inhibitor from a new class with distinct antiviral activity.J Acquir Immune Defic Syndr. 2003 Sep;34 Suppl 1:S91-4. doi: 10.1097/00126334-200309011-00014. J Acquir Immune Defic Syndr. 2003. PMID: 14562864 Review.
-
Tipranavir: a novel non-peptidic protease inhibitor for the treatment of HIV infection.Expert Opin Investig Drugs. 2003 Nov;12(11):1821-8. doi: 10.1517/13543784.12.11.1821. Expert Opin Investig Drugs. 2003. PMID: 14585057 Review.
Cited by
-
Molecular Factors and Pathways of Hepatotoxicity Associated with HIV/SARS-CoV-2 Protease Inhibitors.Int J Mol Sci. 2023 Apr 27;24(9):7938. doi: 10.3390/ijms24097938. Int J Mol Sci. 2023. PMID: 37175645 Free PMC article. Review.
-
Towards polypharmacokinetics: pharmacokinetics of multicomponent drugs and herbal medicines using a metabolomics approach.Evid Based Complement Alternat Med. 2013;2013:819147. doi: 10.1155/2013/819147. Epub 2013 Mar 14. Evid Based Complement Alternat Med. 2013. PMID: 23573155 Free PMC article.
-
Improved drug therapy: triangulating phenomics with genomics and metabolomics.Hum Genomics. 2014 Sep 1;8(1):16. doi: 10.1186/s40246-014-0016-9. Hum Genomics. 2014. PMID: 25181945 Free PMC article. Review.
-
Metabolomics of bronchoalveolar lavage differentiate healthy HIV-1-infected subjects from controls.AIDS Res Hum Retroviruses. 2014 Jun;30(6):579-85. doi: 10.1089/aid.2013.0198. Epub 2014 Feb 10. AIDS Res Hum Retroviruses. 2014. PMID: 24417396 Free PMC article.
-
CPY3A4-mediated α-hydroxyaldehyde formation in saquinavir metabolism.Drug Metab Dispos. 2014 Feb;42(2):213-20. doi: 10.1124/dmd.113.054874. Epub 2013 Nov 8. Drug Metab Dispos. 2014. PMID: 24212380 Free PMC article.
References
-
- Brandon EF, Sparidans RW, Guijt KJ, Löwenthal S, Meijerman I, Beijnen JH, Schellens JH. (2006) In vitro characterization of the human biotransformation and CYP reaction phenotype of ET-743 (Yondelis, Trabectidin), a novel marine anti-cancer drug. Invest New Drugs 24:3–14 - PubMed
-
- Brandon EF, van Ooijen RD, Sparidans RW, Lázaro LL, Heck AJ, Beijnen JH, Schellens JH. (2005) Structure elucidation of aplidine metabolites formed in vitro by human liver microsomes using triple quadrupole mass spectrometry. J Mass Spectrom 40:821–831 - PubMed
-
- Cahn P, Villacian J, Lazzarin A, Katlama C, Grinsztejn B, Arasteh K, López P, Clumeck N, Gerstoft J, Stavrianeas N, et al. (2006) Ritonavir-boosted tipranavir demonstrates superior efficacy to ritonavir-boosted protease inhibitors in treatment-experienced HIV-infected patients: 24-week results of the RESIST-2 trial. Clin Infect Dis 43:1347–1356 - PubMed
-
- Chan-Tack KM, Struble KA, Birnkrant DB. (2008) Intracranial hemorrhage and liver-associated deaths associated with tipranavir/ritonavir: review of cases from the FDA's Adverse Event Reporting System. AIDS Patient Care STDS 22:843–850 - PubMed
Publication types
MeSH terms
Substances
Grants and funding
LinkOut - more resources
Full Text Sources

