. 2010 Apr;20(4):447-57.
doi: 10.1101/gr.098947.109. Epub 2010 Jan 26.

Impact of replication timing on non-CpG and CpG substitution rates in mammalian genomes

Affiliations

Impact of replication timing on non-CpG and CpG substitution rates in mammalian genomes

Chun-Long Chen et al. Genome Res. 2010 Apr.

Abstract

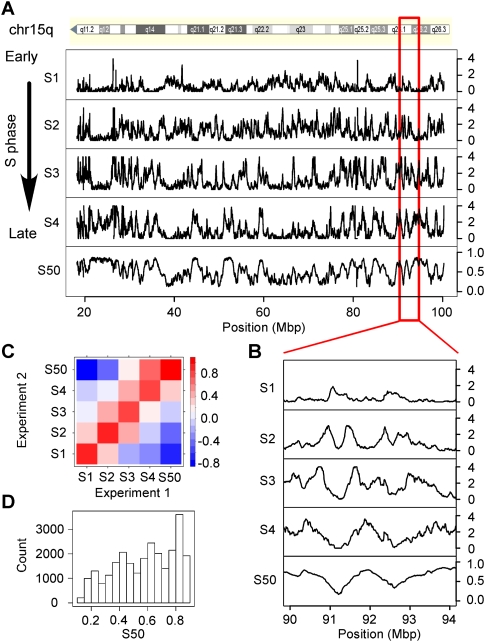
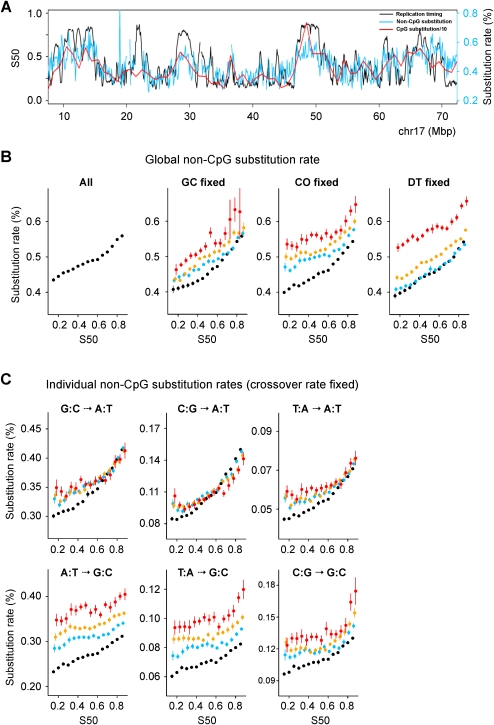
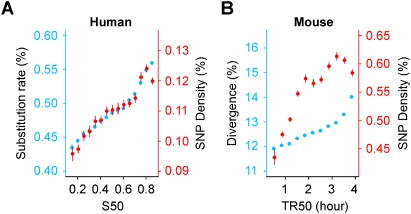
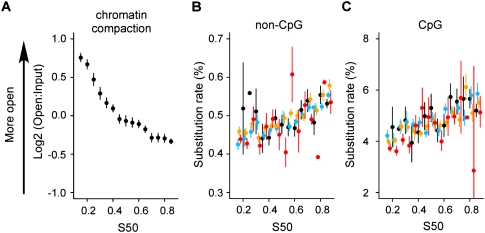
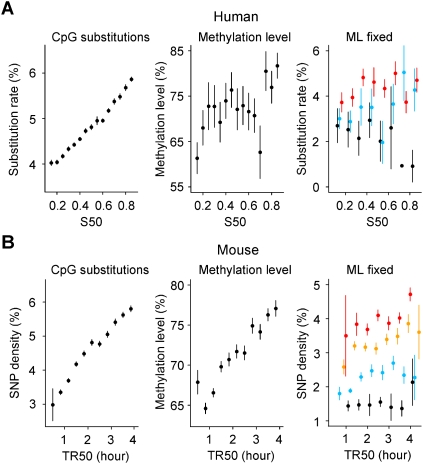
Neutral nucleotide substitutions occur at varying rates along genomes, and it remains a major issue to unravel the mechanisms that cause these variations and to analyze their evolutionary consequences. Here, we study the role of replication in the neutral substitution pattern. We obtained a high-resolution replication timing profile of the whole human genome by massively parallel sequencing of nascent BrdU-labeled replicating DNA. These data were compared to the neutral substitution rates along the human genome, obtained by aligning human and chimpanzee genomes using macaque and orangutan as outgroups. All substitution rates increase monotonously with replication timing even after controlling for local or regional nucleotide composition, crossover rate, distance to telomeres, and chromatin compaction. The increase in non-CpG substitution rates might result from several mechanisms including the increase in mutation-prone activities or the decrease in efficiency of DNA repair during the S phase. In contrast, the rate of C --> T transitions in CpG dinucleotides increases in later-replicating regions due to increasing DNA methylation level that reflects a negative correlation between timing and gene expression. Similar results are observed in the mouse, which indicates that replication timing is a main factor affecting nucleotide substitution dynamics at non-CpG sites and constitutes a major neutral process driving mammalian genome evolution.


Figures

Figure 1.
Figure 1.
Analysis of the replication timing profiles. (A) Profile along human chromosome 15q of the enrichment of sequence reads E computed in 100-kb windows, in four periods of the S phase, S1, S2, S3, S4; S50, profile of the replication timing values (Methods). Small S50 values correspond to early replicating regions; large S50 values correspond to late replicating regions. (B) Enlarged view of E and S50 profiles along a fragment of chromosome 15. (C) Pairwise correlations (Pearson) between the enrichment E determined in the Si periods of the S phase and the S50 values of Experiments 1 and 2. Colors indicate the range of correlation coefficient values; positive correlations are observed only between neighboring Si fractions; S50 values are negatively correlated with S1 and positively correlated with S4. This confirmed that different alleles of the same region were usually replicated at similar periods of the S phase (Farkash-Amar et al. 2008). (D) Histogram of S50 values in the whole genome.
Figure 2.
Figure 2.
Increase in non-CpG substitution rates during the S phase. (A) Substitution rate and replication timing profiles along human chromosome 17. (B) Global substitution rate (all panels). GC fixed: (black) GC ≤ 37%; (blue) 37% < GC ≤ 42%; (orange) 42% < GC ≤ 52%; (red) GC > 52%. CO fixed: (black) CO ≤ 1 cM/Mb; (blue) 1 < CO ≤ 2 cM/Mb; (orange) 2 < CO ≤ 4 cM/Mb; (red) CO > 4 cM/Mb; DT fixed: (black) DT > 50 Mb; (blue) 30 < DT ≤ 50 Mb; (orange) 10 < DT ≤ 30 Mb; (red) DT ≤ 10 Mb. In the abscissa, S50 determined in 100-kb windows (Methods) is shown. In the ordinate, the mean value of the substitution rate ± SEM in percent is shown. The distance between the lines shows dependency on the controlling factor. (C) Individual substitution rates when controlling for CO. Colors are as in B. S → W and W → W rates show moderate dependency on CO. In contrast, W → S rates, and to a lesser extent S → S, depend strongly on CO.
Figure 3.
Figure 3.
Increase in human and mouse non-CpG divergence and diversity during the S phase. (A) The human global substitution rate (blue) and diversity (Levy et al. 2007) (red) as a function of replication timing. The relative increase in the human global rate as a function of timing (28%) is the same as the relative increase in diversity (29%). (B) (Blue) Mouse–rat divergence; (red) mouse diversity; the relative increase of mouse divergence (16%) is smaller than that of diversity (30%). This likely results from substitution saturation due to long evolutionary time since the mouse/rat divergence. Correlation coefficients (Pearson): human diversity and timing (R = 0.23, P < 10−16); mouse diversity and timing (R = 0.21, P < 10−16). All rates are determined in 100-kb windows.
Figure 4.
Figure 4.
(A) Dependence of chromatin compaction with replication timing. Compaction data were from Gilbert et al. (2004). Variation of global non-CpG substitution rate (B) and CpG substitution rate (C) with replication timing after controlling for chromatin compaction. Timing values and substitution rates are determined within all genomic regions for which chromatin compaction was determined (Gilbert et al. 2004). (Black) Log2(Open:Input) ≤ −1; (blue) −1 < log2(Open:Input) ≤ 0; (orange) 0 < log2(Open:Input) ≤ 1; (red) log2(Open:Input) > 1. The window size is as defined in Gilbert et al. (2004) (mean size: 146 kb).
Figure 5.
Figure 5.
Increase of human and mouse CpG substitution rates in later-replicating regions explained by the increase in methylation level. Replication timing and CpG substitution rates are determined in noncoding regions excluding CpG islands (Methods). (A, left) Human CpG substitution rate as function of S50; (center) methylation level determined in human sperm cells (Eckhardt et al. 2006) plotted as a function of the replication timing S50; (right) human CpG substitution rate when controlling for methylation level (ML). (Black) ML ≤ 20%; (blue) 20% < ML ≤ 60%; (red) ML > 60%. (B) Analyses performed with mouse replication timing data TR50 (Farkash-Amar et al. 2008). (Left) Mouse CpG diversity was computed with SNP data (The International HapMap Consortium 2007); (center) methylation level determined in mouse embryonic stem cells (Meissner et al. 2008) plotted as a function of replication timing; (right) Mouse CpG SNP density when controlling for ML. (Black) ML ≤ 45%; (blue) 45% < ML ≤ 60%; (orange) 60% < ML ≤ 70%; (red) ML > 70%. DNA methylation levels, substitution rates, divergence, and replication timing were computed as indicated in Methods. The window size is as indicated in Methods (DNA Methylation section).

Similar articles

Cited by

References

    1. Azuara V. Profiling of DNA replication timing in unsynchronized cell populations. Nat Protoc. 2006;1:2171–2177. - PubMed
    1. Barnes DE, Lindahl T. Repair and genetic consequences of endogenous DNA base damage in mammalian cells. Annu Rev Genet. 2004;38:445–476. - PubMed
    1. Bentley DR, Balasubramanian S, Swerdlow HP, Smith GP, Milton J, Brown CG, Hall KP, Evers DJ, Barnes CL, Bignell HR, et al. Accurate whole human genome sequencing using reversible terminator chemistry. Nature. 2008;456:53–59. - PMC - PubMed
    1. Berglund J, Pollard KS, Webster MT. Hotspots of biased nucleotide substitutions in human genes. PLoS Biol. 2009;7:e26. doi: 10.1371/journal.pbio.1000026. - DOI - PMC - PubMed
    1. Cross SH, Bird AP. CpG islands and genes. Curr Opin Genet Dev. 1995;5:309–314. - PubMed

Publication types

LinkOut - more resources