. 2010 Feb 1;70(3):1173-83.
doi: 10.1158/0008-5472.CAN-09-2886. Epub 2010 Jan 26.

Caffeine-mediated inhibition of calcium release channel inositol 1,4,5-trisphosphate receptor subtype 3 blocks glioblastoma invasion and extends survival

Affiliations

Caffeine-mediated inhibition of calcium release channel inositol 1,4,5-trisphosphate receptor subtype 3 blocks glioblastoma invasion and extends survival

Sang Soo Kang et al. Cancer Res. .

Abstract

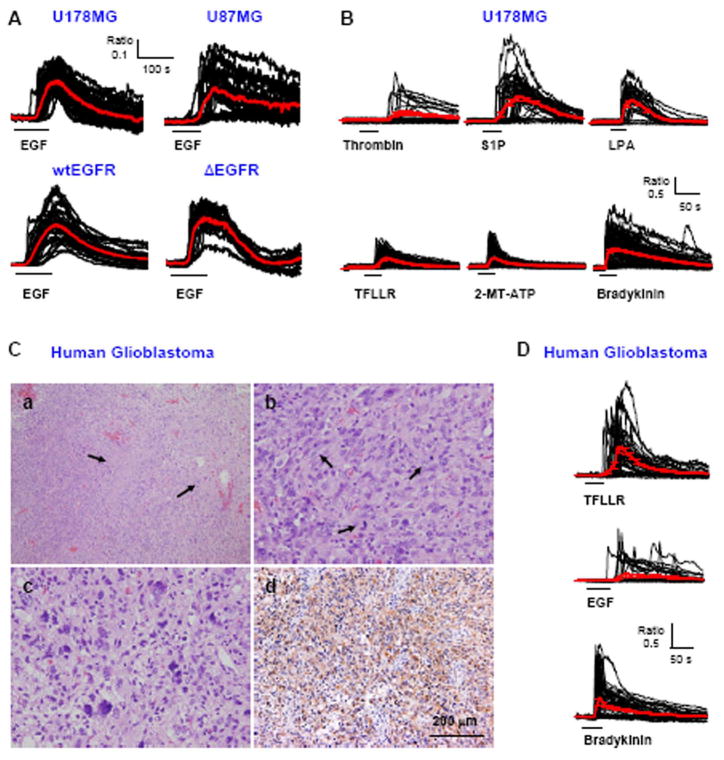
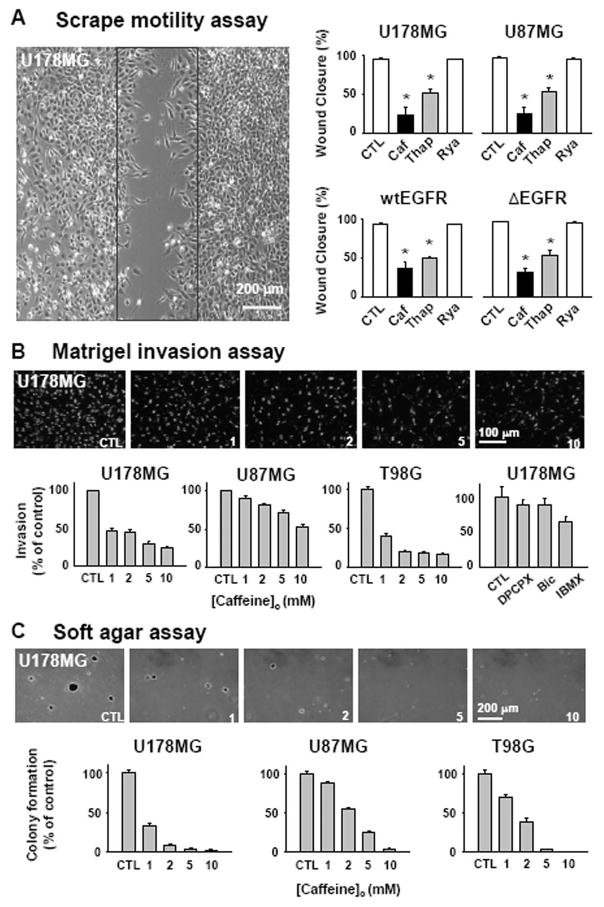
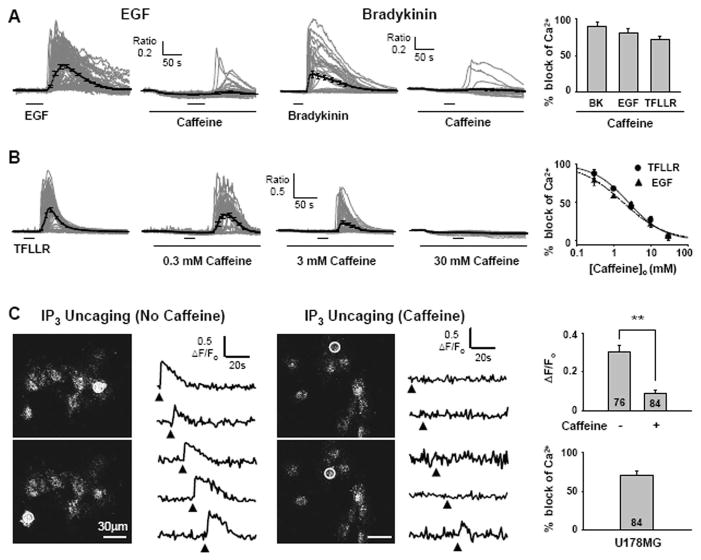
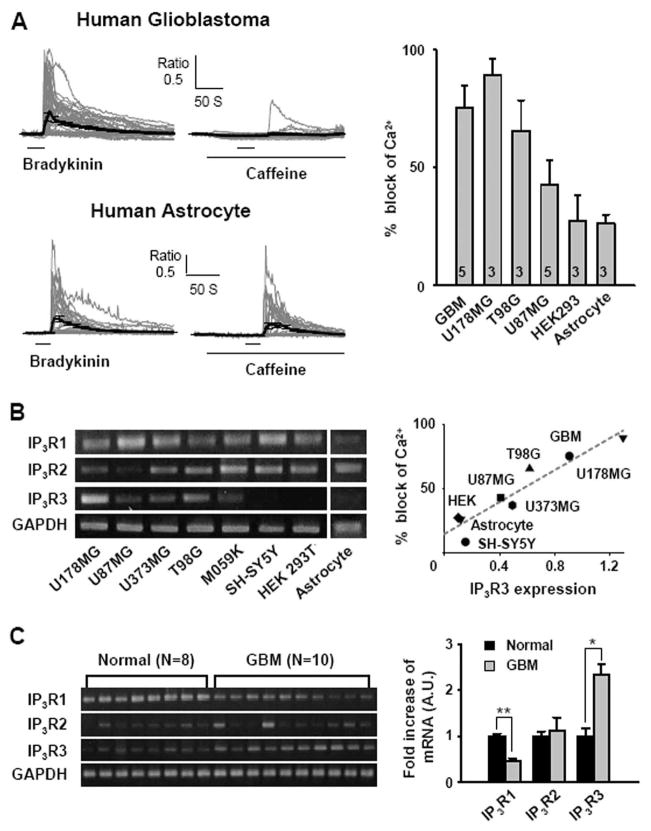
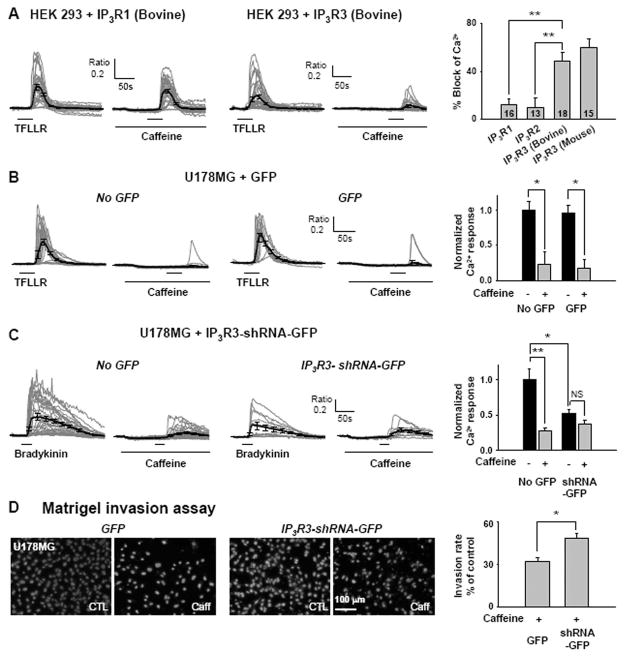
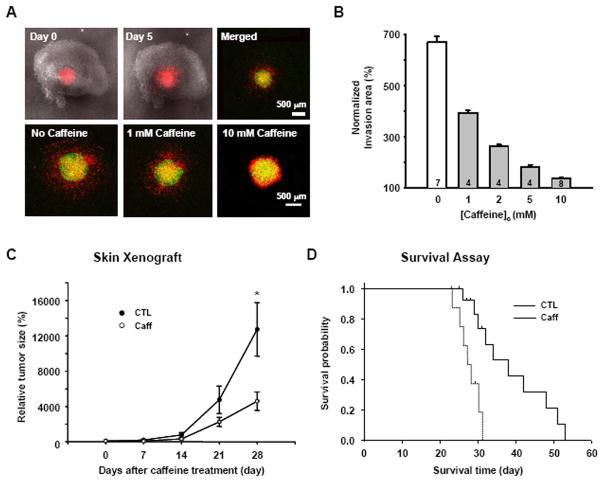
Calcium signaling is important in many signaling processes in cancer cell proliferation and motility including in deadly glioblastomas of the brain that aggressively invade neighboring tissue. We hypothesized that disturbing Ca(2+) signaling pathways might decrease the invasive behavior of giloblastoma, extending survival. Evaluating a panel of small-molecule modulators of Ca(2+) signaling, we identified caffeine as an inhibitor of glioblastoma cell motility. Caffeine, which is known to activate ryanodine receptors, paradoxically inhibits Ca(2+) increase by inositol 1,4,5-trisphospate receptor subtype 3 (IP(3)R3), the expression of which is increased in glioblastoma cells. Consequently, by inhibiting IP(3)R3-mediated Ca(2+) release, caffeine inhibited migration of glioblastoma cells in various in vitro assays. Consistent with these effects, caffeine greatly increased mean survival in a mouse xenograft model of glioblastoma. These findings suggest IP(3)R3 as a novel therapeutic target and identify caffeine as a possible adjunct therapy to slow invasive growth of glioblastoma.


Figures

Fig. 1
Fig. 1. Ca2+ responses by various GPCR and RTK agonists
A. Traces from Ca2+ imaging recordings performed in U178MG, U87MG, wtEGFR-U87MG, or Δ EGFR-U87MG cells. Each trace represents a Ca2+ response in one cell (n=36–83 per cell line). Red lines represent average responses with error bars indicating standard error of mean (SEM). Black horizontal bars show time and duration of 100 ng/ml EGF application. B. Ca2+ responses by 100 nM Thrombin, 10 μM S1P, 30 μM LPA, 30 μM TFLLR, 100 μM 2-MT-ATP, and 10 μM Bradykinin in U178MG. C. (a) Low magnification view of this tumor showing cellular glial tumor with two foci of pseudopalisading necrosis (arrows) (H&E). (b) The tumor shows frequent mitotic cells (arrows) (H&E), (c) Mutinulcleated pleomorphic nuclei are present. (H&E). (d) Most of the tumor cells are immunoreactive for GFAP. (GFAP immunostaining). D. Ca2+ responses induced by GPCR and RTK agonists in the primary human glioblastoma cells.
Fig. 2
Fig. 2. Caffeine slows motility, invasion, and colony formation of glioblastoma cells
A. Monolayers of glioblastoma cells were wounded by a scrape (black box) and treated with 10 mM caffeine (Caf), 1 μM thapsigargin (Thap), or 10 μM ryanodine (Rya). All error bars represent SEM. (*p <0.01, ANOVA with Newman-Keuls post hoc.). B. (Top) representative pictures of DAPI labeled cells that invaded through 8 μm holes in the Matrigel inserts in the presence of indicated caffeine concentration. (Bottom) percentage of invaded cells respect to the control condition. Similar experiment was done with 800nM DPCPX, 10 μM Bicuculline, 100 μM IBMX and % of invasion was plotted (last panel). C. Caffeine effect on the anchorage-independent growth of glioblastoma cells in vitro was tested. (Top) representative photographs of colonies grown in indicated caffeine concentration. (Bottom) percentage of number of colony normalized to the control condition.
Fig. 3
Fig. 3. Caffeine reduces GPCR and RTK induced Ca2+ increase by inhibiting IP3R
A. EGF or bradykinin induced Ca2+ responses in the absence or presence of caffeine in U178MG cells. 10 mM caffeine was treated 100 s before stimulation with indicated agonist. % block of various agonists induced Ca2+ release by 10 mM caffeine in U178MG cells. The peak of average Ca2+ response trace in the presence of caffeine was divided by the average of Ca2+ response in the absence of caffeine. (N=3) B. TFLLR-induced Ca2+ responses in the presence of 0.3 mM, 3 mM, and 30 mM caffeine. Concentration-effect curve of Ca2+ increase evoked by TFLLR (IC50: 2.45 mM) or EGF (IC50: 1.87 mM). C. Left panels show intensity images of U178MG cells loaded with caged IP3 and Oregon green 488 BAPTA-2. White circles indicate region of interest exposed to a 405 nm laser for uncaging of IP3. Right traces are representative fluorescence changes upon laser stimulation (filled triangle) over time in the absence of caffeine or in the presence of 10 mM caffeine. The average fluorescence intensity changes in the presence or absence of caffeine at the peak of Ca2+ transients (**p <0.001 by student’s t-test). Summary of IP3 uncaging experiment. Caffeine blocks 71% of Ca2+ release in U178MG cells.
Fig. 4
Fig. 4. Correlation between IP3R3 and block of Ca2+ release by caffeine
A. Block of bradykinin-induced increase in [Ca2+]i by caffeine on the primary human glioblastoma cells and astrocytes. Summary of block of GPCR agonist-induced Ca2+ responses by caffeine on various cell types. B. mRNA expression of IP3Rs and GAPDH was tested by semi-quantitative RT-PCR in various human glioblastoma cell lines (U87MG, U178MG, U373MG, T98G, M059K), human neuroblastoma cell line (SH-SY5Y), human embryonic kidney cell line (HEK293T), and human astrocyte. Correlation between expression of IP3R subtype 3 normalized to GAPDH in each cell type and caffeine block of agonist induced Ca2+ responses. (r 2=0.891, p<0.001) C. Semi-quantitative RT-PCR of IP3R subtypes in normal human brain and human glioblastoma tissue samples. Averages of densitometric measurement of IP3R mRNA expression in human samples, normalized to the normal human brain tissue sample (*p<0.001, **p<0.0001 by student’s t-test).
Fig. 5
Fig. 5. IP3R 3 is required for caffeine sensitivity
A. Block of TFLLR-induced increase in [Ca2+]i by 10 mM caffeine in HEK293T cells transfected with IP3R1(Bovine) and IP3R3(Bovine). Summary of % block by caffeine in HEK293T cells transfected with IP3R1(Bovine), IP3R2(Bovine), IP3R3(Bovine), or IP3R3(Mouse) (**p<0.001 by Student’s t-test). B. Ca2+ responses of GFP negative and positive cells on U178MG transfected with vector containing only GFP. Ca2+ responses in each condition are normalized to Ca2+ responses in GFP negative without caffeine treatment (*p<0.05 by Student’s t-test). C. Ca2+ responses of GFP negative and positive cells on U178MG transfected with vector containing IP3R3-shRNA and GFP. Ca2+ responses in each condition are normalized to Ca2+ responses in GFP negative without caffeine treatment (*p<0.05, **p<0.001 by Student’s t-test). D. Results of the Matrigel invasion assay on IP3R3-shRNA expressing cells and GFP expressing cells with or without caffeine treatment. Summary of the Matrigel invasion assay with IP3R3-shRNA expressing cells significantly less inhibition of invasion by caffeine (*p<0.01, student’s t-test).
Fig. 6
Fig. 6. Caffeine inhibits invasion and increases survival rate
A. DiI-stained U178MG cells were placed on the surface of slices in the absence or presence of caffeine (0~10 mM) 6 days after slice preparation. The first two merged DIC and red fluorescence images show the hippocampal brain slice and DiI-stained U178MG cells. After 1 h (Green) and 120 h (Red), movement of the glioblastoma cells in the slices was detected with an inverted confocal laser scanning microscope. B. Invasion area (%) was calculated from the formula, Area of DiI-stained cells at 120 h/Area of DiI-stained cells at 1h) × 100. C. Effect of caffeine on the growth of U87MG cells in vivo skin xenograft model (*p<0.01). D. Kaplan-Meier survival curves of nude mouse bearing intracranial U87MG tumors. Log rank, p=0.001, control versus caffeine.

Similar articles

Cited by

References

    1. Rao JS. Molecular mechanisms of glioma invasiveness: the role of proteases. Nat Rev Cancer. 2003;3:489–501. - PubMed
    1. Nakada M, Nakada S, Demuth T, et al. Molecular targets of glioma invasion. Cell Mol Life Sci. 2007;64:458–78. - PMC - PubMed
    1. McFerrin MB, Sontheimer H. A role for ion channels in glioma cell invasion. Neuron Glia Biol. 2006;2:39–49. - PMC - PubMed
    1. Schafer B, Gschwind A, Ullrich A. Multiple G-protein-coupled receptor signals converge on the epidermal growth factor receptor to promote migration and invasion. Oncogene. 2004;23:991–9. - PubMed
    1. Junge CE, Lee CJ, Hubbard KB, et al. Protease-activated receptor-1 in human brain: localization and functional expression in astrocytes. Exp Neurol. 2004;188:94–103. - PubMed

Publication types

MeSH terms