

Nek4 status differentially alters sensitivity to distinct microtubule poisons
- PMID: 20103636
- PMCID: PMC2946156
- DOI: 10.1158/0008-5472.CAN-09-2113
Nek4 status differentially alters sensitivity to distinct microtubule poisons
Abstract
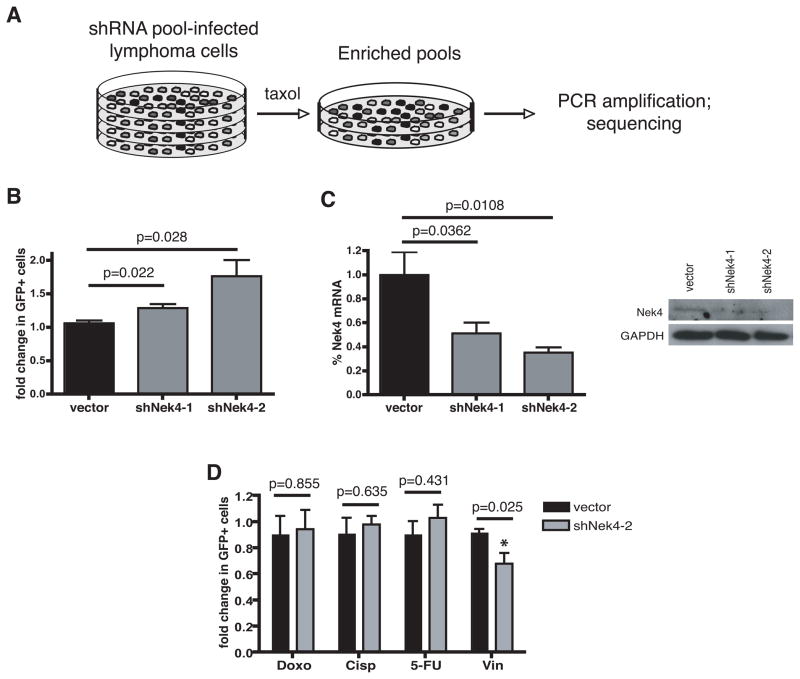
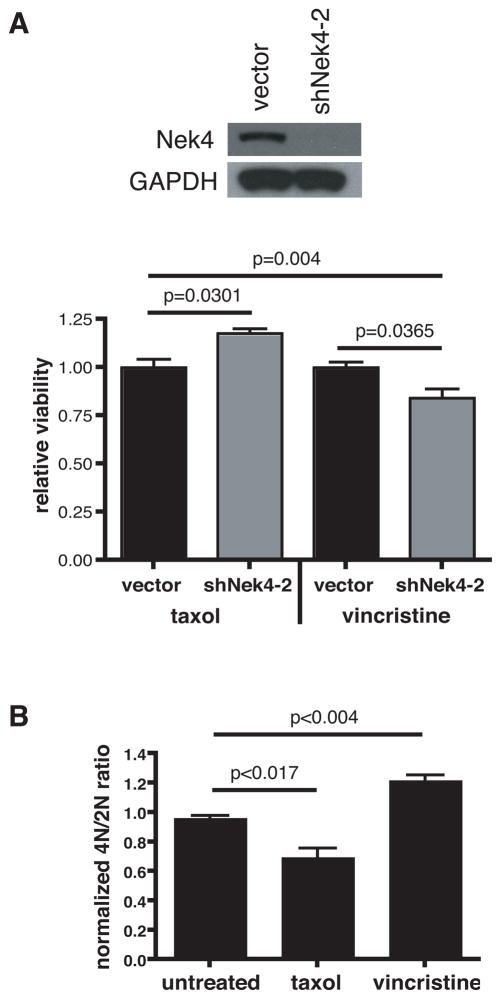
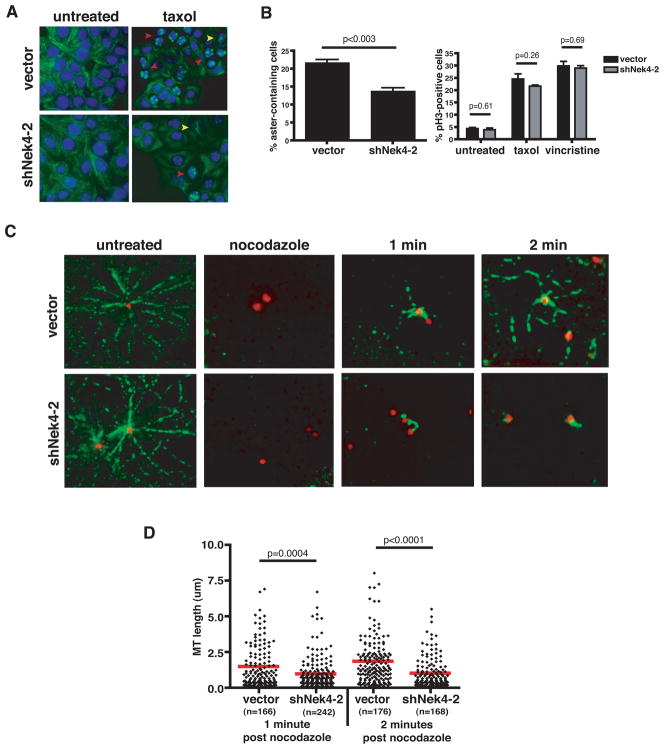
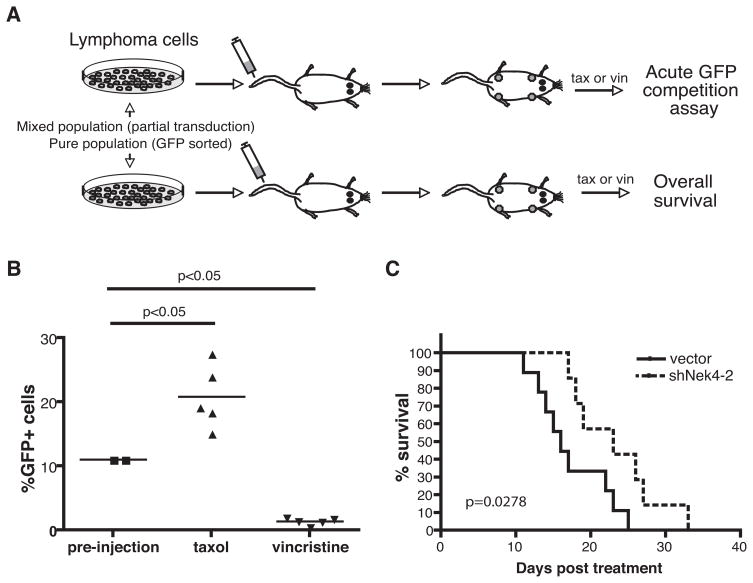
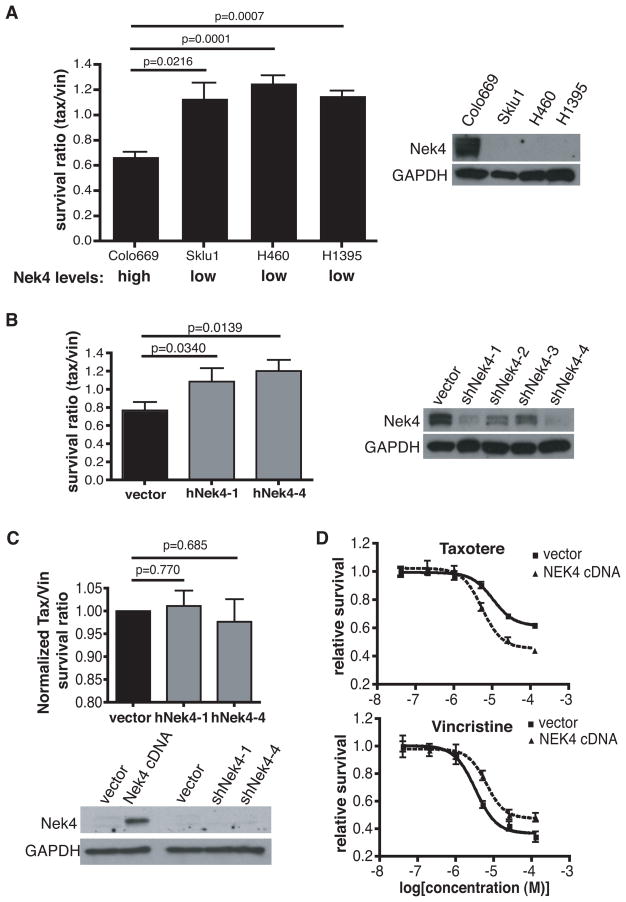
Microtubule poisons are widely used in cancer treatment, but the factors determining the relative efficacy of different drugs in this class remain obscure. In this study, we identified the NIMA kinase Nek4 in a genetic screen for mediators of the response to Taxol, a chemotherapeutic agent that stabilizes microtubules. After Taxol treatment, Nek4 promoted microtubule outgrowth, whereas Nek4 deficiency impaired G(2)-M arrest and decreased formation of mitotic-like asters. In contrast, Nek4 deficiency sensitized cells to vincristine, which destabilizes microtubules. Therefore, Nek4 deficiency may either antagonize or agonize the effects of microtubule poisons, depending on how they affect microtubule polymerization. Of note, Nek4 gene maps to a commonly deleted locus in non-small cell lung cancer. Thus, Nek4 deletion in this disease may rationalize the use of particular types of microtubule poisons for lung cancer therapy.
Figures
Similar articles
-
NIMA-related kinases 6, 4, and 5 interact with each other to regulate microtubule organization during epidermal cell expansion in Arabidopsis thaliana.Plant J. 2011 Sep;67(6):993-1005. doi: 10.1111/j.1365-313X.2011.04652.x. Epub 2011 Jul 1. Plant J. 2011. PMID: 21605211
-
NIMA-related kinases regulate directional cell growth and organ development through microtubule function in Arabidopsis thaliana.Plant Signal Behav. 2012 Dec;7(12):1552-5. doi: 10.4161/psb.22412. Epub 2012 Oct 16. Plant Signal Behav. 2012. PMID: 23072999 Free PMC article.
-
Reversal of stathmin-mediated microtubule destabilization sensitizes retinoblastoma cells to a low dose of antimicrotubule agents: a novel synergistic therapeutic intervention.Invest Ophthalmol Vis Sci. 2011 Jul 23;52(8):5441-8. doi: 10.1167/iovs.10-6973. Invest Ophthalmol Vis Sci. 2011. PMID: 21546534
-
Taxol®: The First Microtubule Stabilizing Agent.Int J Mol Sci. 2017 Aug 9;18(8):1733. doi: 10.3390/ijms18081733. Int J Mol Sci. 2017. PMID: 28792473 Free PMC article. Review.
-
Structure, function, and evolution of plant NIMA-related kinases: implication for phosphorylation-dependent microtubule regulation.J Plant Res. 2015 Nov;128(6):875-91. doi: 10.1007/s10265-015-0751-6. Epub 2015 Sep 9. J Plant Res. 2015. PMID: 26354760 Review.
Cited by
-
NEK4 kinase regulates EMT to promote lung cancer metastasis.J Cell Mol Med. 2018 Dec;22(12):5877-5887. doi: 10.1111/jcmm.13857. Epub 2018 Sep 24. J Cell Mol Med. 2018. PMID: 30247800 Free PMC article.
-
Katanin localization requires triplet microtubules in Chlamydomonas reinhardtii.PLoS One. 2013;8(1):e53940. doi: 10.1371/journal.pone.0053940. Epub 2013 Jan 8. PLoS One. 2013. PMID: 23320108 Free PMC article.
-
New interaction partners for Nek4.1 and Nek4.2 isoforms: from the DNA damage response to RNA splicing.Proteome Sci. 2015 Feb 26;13:11. doi: 10.1186/s12953-015-0065-6. eCollection 2015. Proteome Sci. 2015. PMID: 25798074 Free PMC article.
-
In Mitosis You Are Not: The NIMA Family of Kinases in Aspergillus, Yeast, and Mammals.Int J Mol Sci. 2022 Apr 6;23(7):4041. doi: 10.3390/ijms23074041. Int J Mol Sci. 2022. PMID: 35409400 Free PMC article. Review.
-
NEK kinases in cell cycle regulation, DNA damage response, and cancer progression.Tissue Cell. 2025 Jun;94:102811. doi: 10.1016/j.tice.2025.102811. Epub 2025 Feb 28. Tissue Cell. 2025. PMID: 40037068 Review.
References
-
- Jordan MA, Wilson L. Microtubules and actin filaments: dynamic targets for cancer chemotherapy. Curr Opin Cell Biol. 1998;10(1):123–30. - PubMed
-
- Bhalla K, Ibrado AM, Tourkina E, Tang C, Mahoney ME, Huang Y. Taxol induces internucleosomal DNA fragmentation associated with programmed cell death in human myeloid leukemia cells. Leukemia. 1993;7(4):563–8. - PubMed
-
- Danesi R, Figg WD, Reed E, Myers CE. Paclitaxel (taxol) inhibits protein isoprenylation and induces apoptosis in PC-3 human prostate cancer cells. Mol Pharmacol. 1995;47(6):1106–11. - PubMed
-
- Martin SJ, Cotter TG. Disruption of microtubules induces an endogenous suicide pathway in human leukaemia HL-60 cells. Cell Tissue Kinet. 1990;23(6):545–59. - PubMed
Publication types
MeSH terms
Substances
Grants and funding
LinkOut - more resources
Full Text Sources
Other Literature Sources
Molecular Biology Databases
