

Validation of SAG/RBX2/ROC2 E3 ubiquitin ligase as an anticancer and radiosensitizing target
- PMID: 20103673
- PMCID: PMC2819752
- DOI: 10.1158/1078-0432.CCR-09-1592
Validation of SAG/RBX2/ROC2 E3 ubiquitin ligase as an anticancer and radiosensitizing target
Abstract
Purpose: Sensitive to apoptosis gene (SAG; also known as RBX2 or ROC2) was originally cloned as a redox-inducible antioxidant protein and was later characterized as a RING component of SCF E3 ubiquitin ligases. SAG overexpression inhibits apoptosis induced by many stimuli both in vitro and in vivo. SAG mRNA was overexpressed in human lung tumor tissues with a correlation to poor patient survival. To investigate whether SAG serves as an anticancer target, we determined the effect of SAG silencing on cell proliferation, survival, and radiosensitivity.
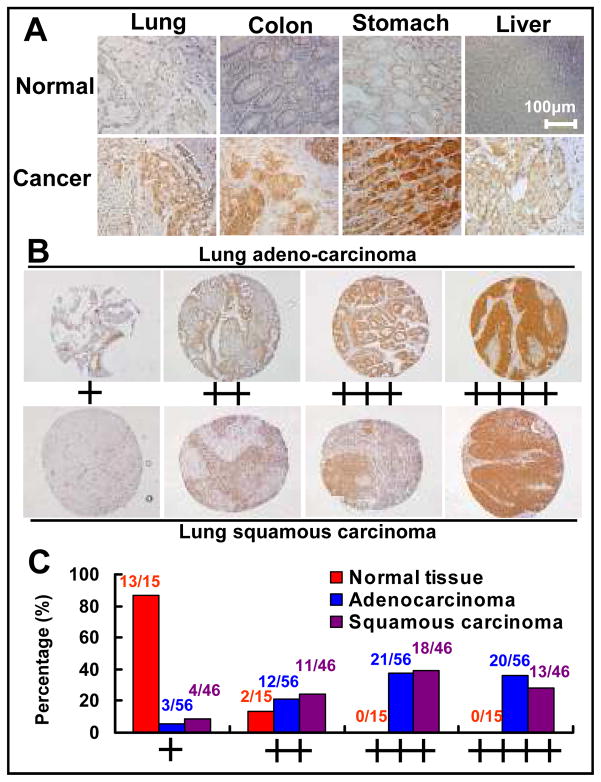
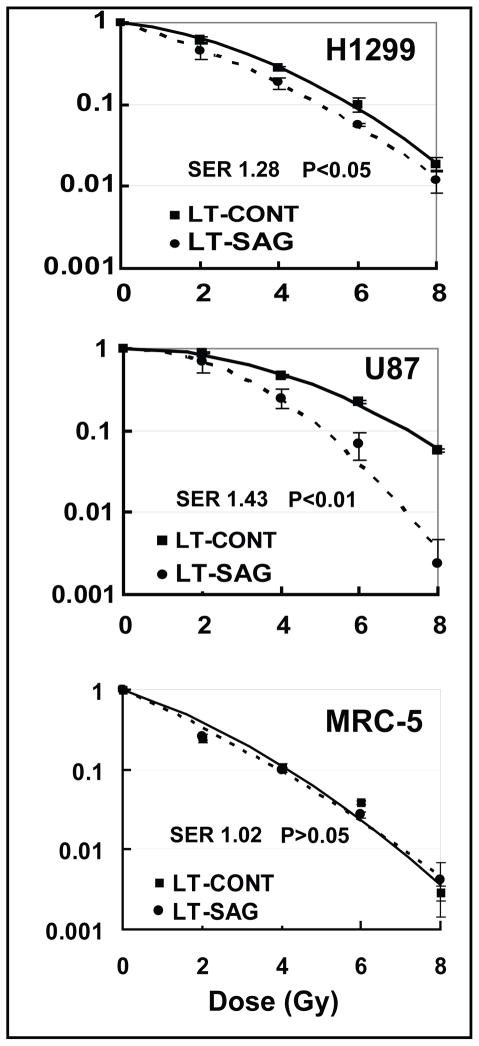
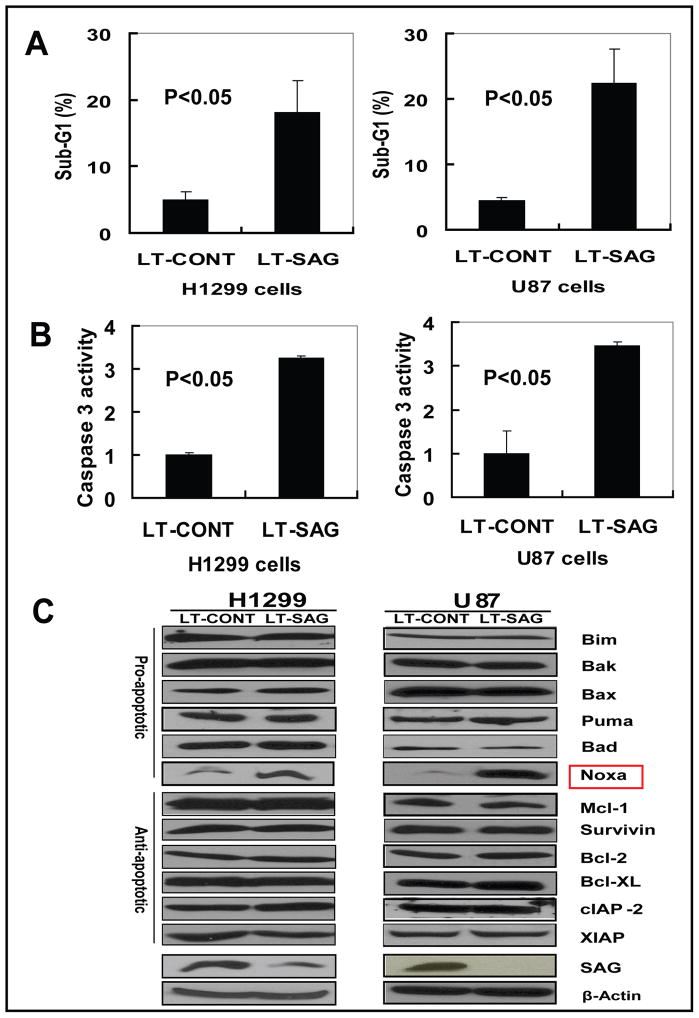
Experimental design: SAG protein expression in human tumors was evaluated by immunohistochemical staining using tumor tissue arrays. SAG expression in cancer cells was knocked down by siRNA silencing. The anticancer effects of SAG silencing were evaluated by in vitro assays for cell growth and survival and by an in vivo orthotopic xenograft tumor model. Radiosensitization by SAG silencing of human cancer cells was determined by clonogenic survival assay. Apoptosis induction was evaluated by fluorescence-activated cell sorting analysis, caspase-3 activation assay, and Western blotting of apoptosis-associated proteins.
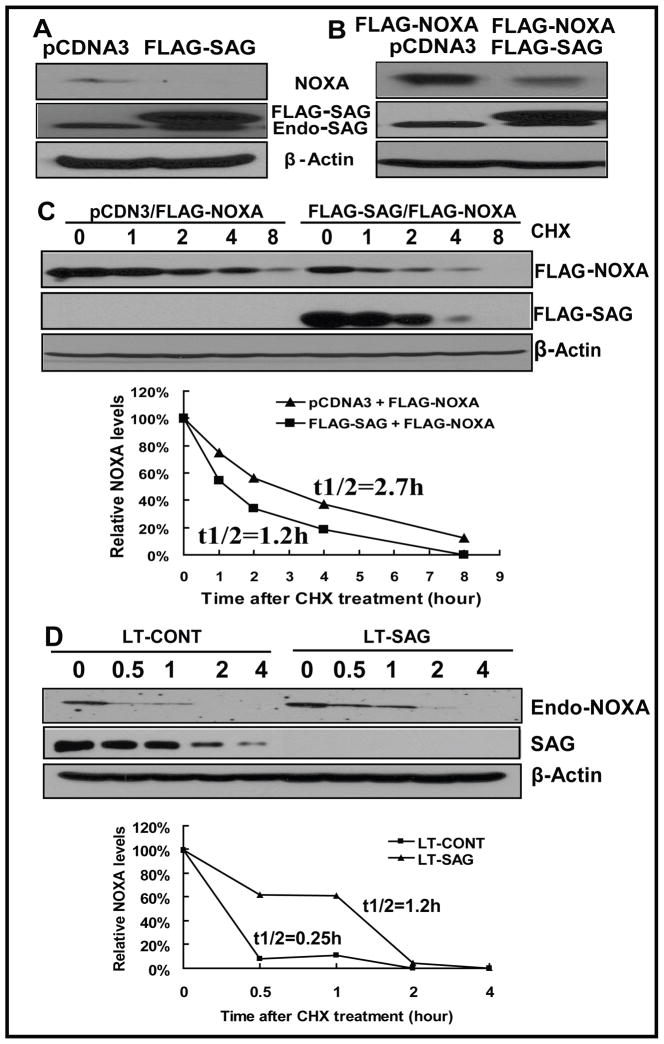
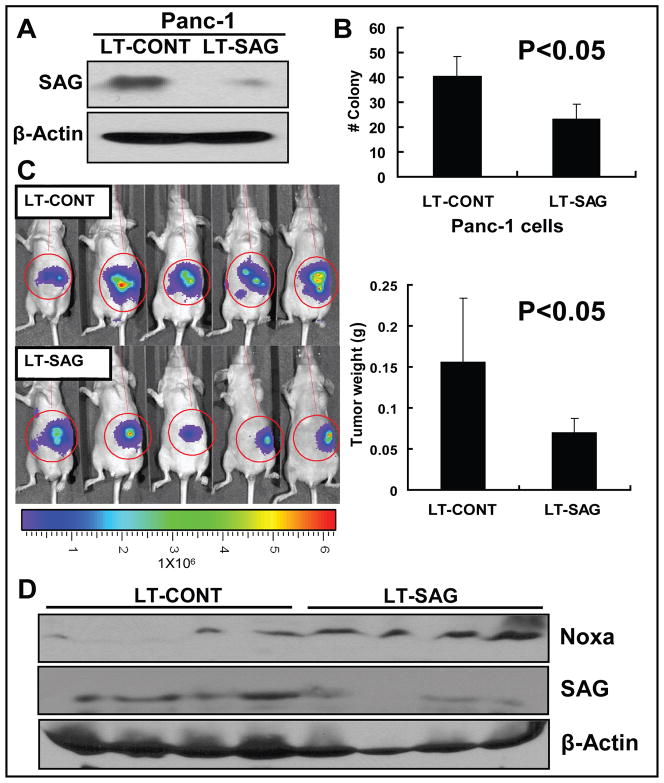
Results: SAG was overexpressed in multiple human tumor tissues compared with their normal counterparts. SAG silencing selectively inhibited cancer cell proliferation, suppressed in vivo tumor growth, and sensitized radiation-resistant cancer cells to radiation. Mechanistically, SAG silencing induced apoptosis with accumulation of NOXA, whereas SAG overexpression reduced NOXA levels and shortened NOXA protein half-life.
Conclusions: The findings showed that SAG E3 ubiquitin ligase plays an essential role in cancer cell proliferation and tumor growth and may serve as a promising anticancer and radiosensitizing target.
Figures

Similar articles
-
SAG/ROC-SCF beta-TrCP E3 ubiquitin ligase promotes pro-caspase-3 degradation as a mechanism of apoptosis protection.Neoplasia. 2006 Dec;8(12):1042-54. doi: 10.1593/neo.06568. Neoplasia. 2006. PMID: 17217622 Free PMC article.
-
Functional characterization of SAG/RBX2/ROC2/RNF7, an antioxidant protein and an E3 ubiquitin ligase.Protein Cell. 2013 Feb;4(2):103-16. doi: 10.1007/s13238-012-2105-7. Epub 2012 Nov 8. Protein Cell. 2013. PMID: 23136067 Free PMC article. Review.
-
Depletion of SAG/RBX2 E3 ubiquitin ligase suppresses prostate tumorigenesis via inactivation of the PI3K/AKT/mTOR axis.Mol Cancer. 2016 Dec 12;15(1):81. doi: 10.1186/s12943-016-0567-6. Mol Cancer. 2016. PMID: 27955654 Free PMC article.
-
Inactivation of SAG E3 ubiquitin ligase blocks embryonic stem cell differentiation and sensitizes leukemia cells to retinoid acid.PLoS One. 2011;6(11):e27726. doi: 10.1371/journal.pone.0027726. Epub 2011 Nov 15. PLoS One. 2011. PMID: 22110742 Free PMC article.
-
SAG/ROC/Rbx/Hrt, a zinc RING finger gene family: molecular cloning, biochemical properties, and biological functions.Antioxid Redox Signal. 2001 Aug;3(4):635-50. doi: 10.1089/15230860152542989. Antioxid Redox Signal. 2001. PMID: 11554450 Review.
Cited by
-
A bioinformatics filtering strategy for identifying radiation response biomarker candidates.PLoS One. 2012;7(6):e38870. doi: 10.1371/journal.pone.0038870. Epub 2012 Jun 29. PLoS One. 2012. PMID: 22768051 Free PMC article.
-
Aloperine executes antitumor effects against multiple myeloma through dual apoptotic mechanisms.J Hematol Oncol. 2015 Mar 15;8:26. doi: 10.1186/s13045-015-0120-x. J Hematol Oncol. 2015. PMID: 25886453 Free PMC article.
-
Role of SKP1-CUL1-F-box-protein (SCF) E3 ubiquitin ligases in skin cancer.J Genet Genomics. 2013 Mar 20;40(3):97-106. doi: 10.1016/j.jgg.2013.02.001. Epub 2013 Feb 10. J Genet Genomics. 2013. PMID: 23522382 Free PMC article. Review.
-
Human FBXL8 Is a Novel E3 Ligase Which Promotes BRCA Metastasis by Stimulating Pro-Tumorigenic Cytokines and Inhibiting Tumor Suppressors.Cancers (Basel). 2020 Aug 7;12(8):2210. doi: 10.3390/cancers12082210. Cancers (Basel). 2020. PMID: 32784654 Free PMC article.
-
Role of E3 ubiquitin ligases in lung cancer.World J Clin Oncol. 2013 Aug 10;4(3):58-69. doi: 10.5306/wjco.v4.i3.58. World J Clin Oncol. 2013. PMID: 23936758 Free PMC article.
References
-
- Nalepa G, Rolfe M, Harper JW. Drug discovery in the ubiquitin-proteasome system. Nat Rev Drug Discov. 2006;5:596–613. - PubMed
-
- Orlowski RZ. Proteasome inhibitors in cancer therapy. Methods Mol Biol. 2005;301:339–50. - PubMed
-
- Nakayama KI, Nakayama K. Ubiquitin ligases: cell-cycle control and cancer. Nat Rev Cancer. 2006;6:369–81. - PubMed
-
- Petroski MD, Deshaies RJ. Function and regulation of cullin-RING ubiquitin ligases. Nat Rev Mol Cell Biol. 2005;6:9–20. - PubMed
Publication types
MeSH terms
Substances
Grants and funding
LinkOut - more resources
Full Text Sources
Research Materials
