

TKTL1 is activated by promoter hypomethylation and contributes to head and neck squamous cell carcinoma carcinogenesis through increased aerobic glycolysis and HIF1alpha stabilization
- PMID: 20103683
- PMCID: PMC2824550
- DOI: 10.1158/1078-0432.CCR-09-2604
TKTL1 is activated by promoter hypomethylation and contributes to head and neck squamous cell carcinoma carcinogenesis through increased aerobic glycolysis and HIF1alpha stabilization
Abstract
Purpose: This study aims to investigate the role of the aberrant expression of Transkelolase-like 1 (TKTL1) in head and neck squamous cell carcinoma (HNSCC) tumorigenesis and to characterize TKTL1 contribution to HNSCC tumorigenesis through aerobic glycolysis and HIF1alpha stabilization.
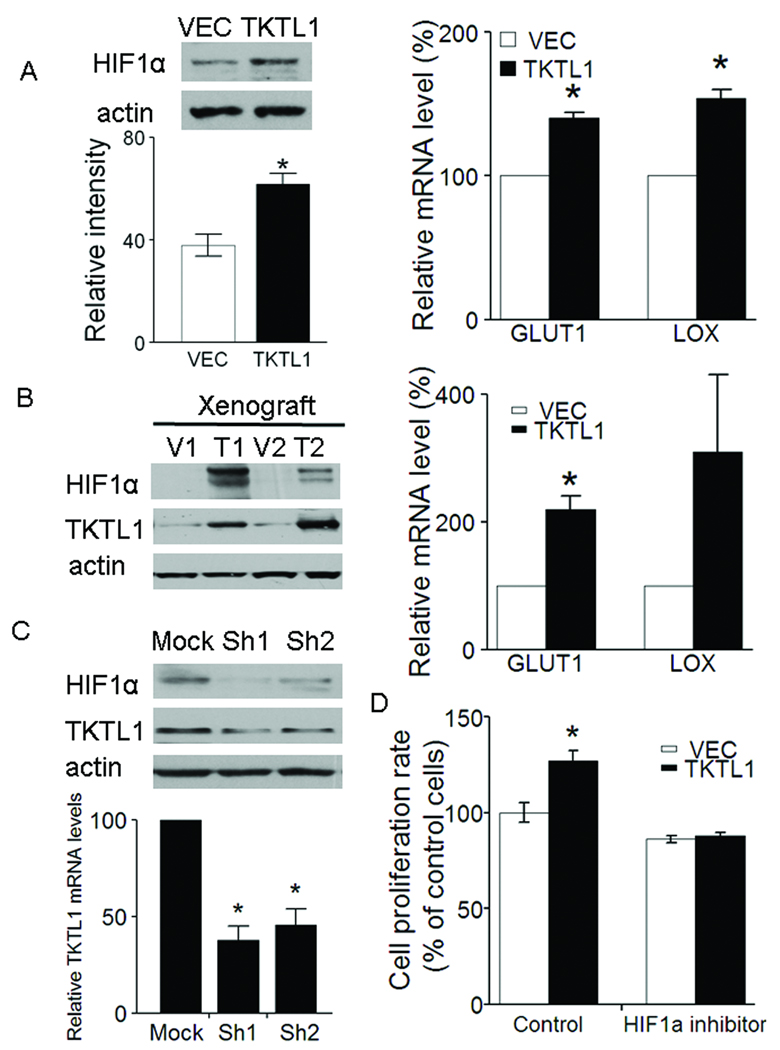
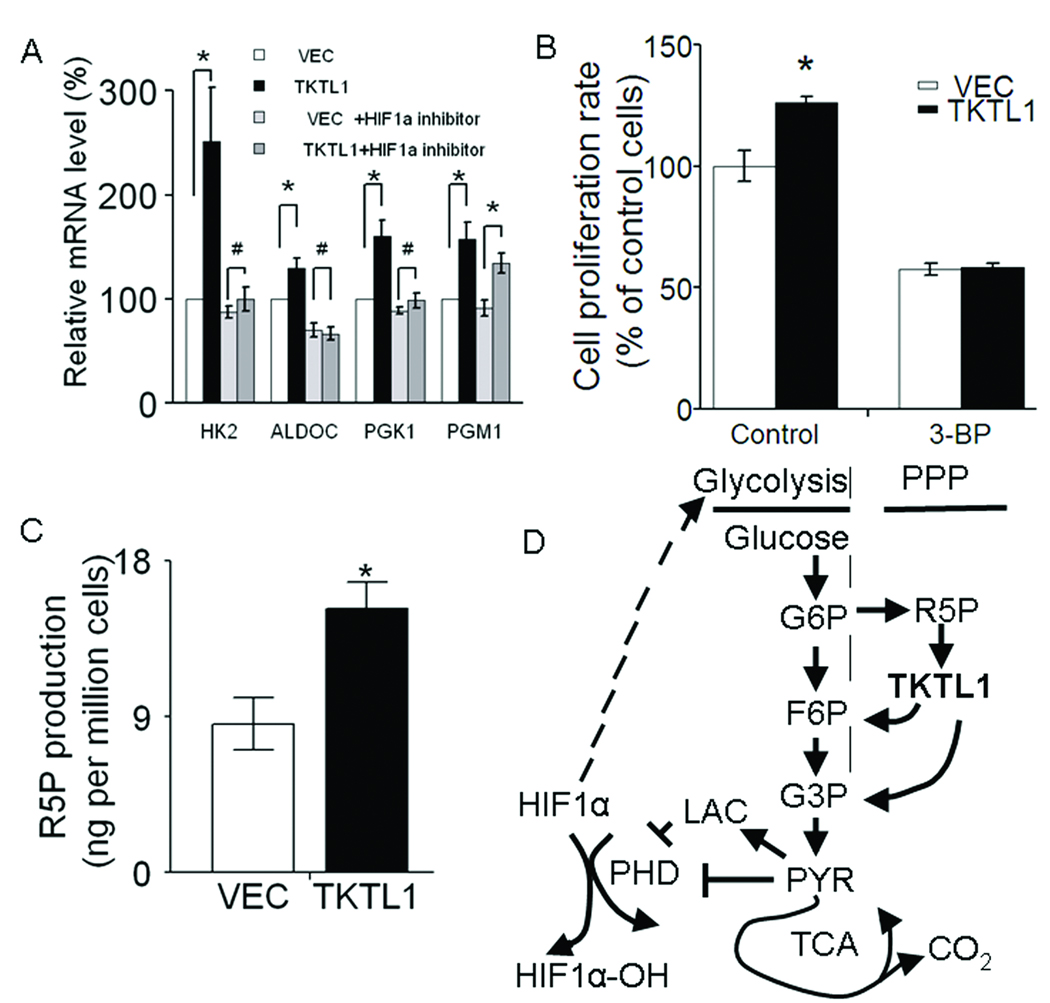
Experimental design: TKTL1 promoter hypomethylation and mRNA/protein aberrant expression were studied in human HNSCC tumor samples and normal mucosas. Oncogenic functions of TKTL1 were examined in HNSCC cell line panels and tumor xenograft models with TKTL1 expression construct. The metabolite levels of fructose-6-phosphate, glyceraldehydes-3-phosphate, pyruvate, lactate, and the levels of HIF1alpha protein and its downsteam glycolytic targets were compared between the TKTL1-expressing and vehicle-expressing HNSCC cells. Meanwhile, the effects of HIF1alpha/glycolytic inhibitors were evaluated on the TKTL1 transfectants.
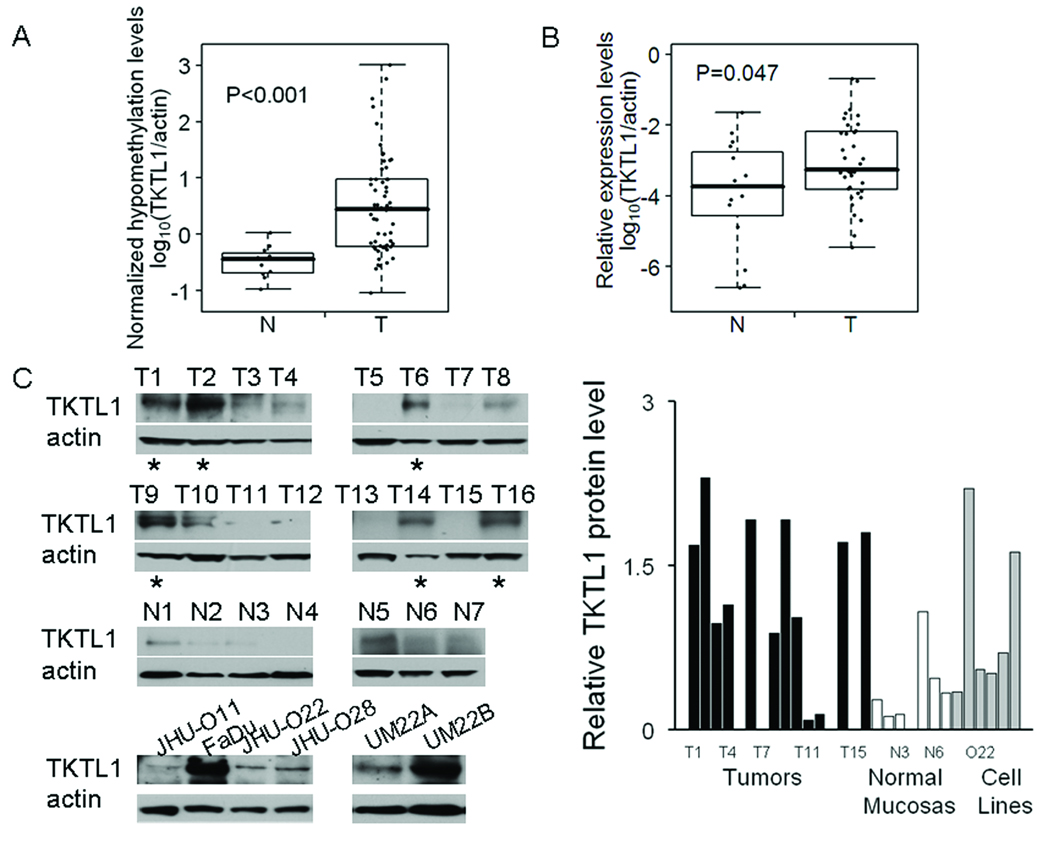
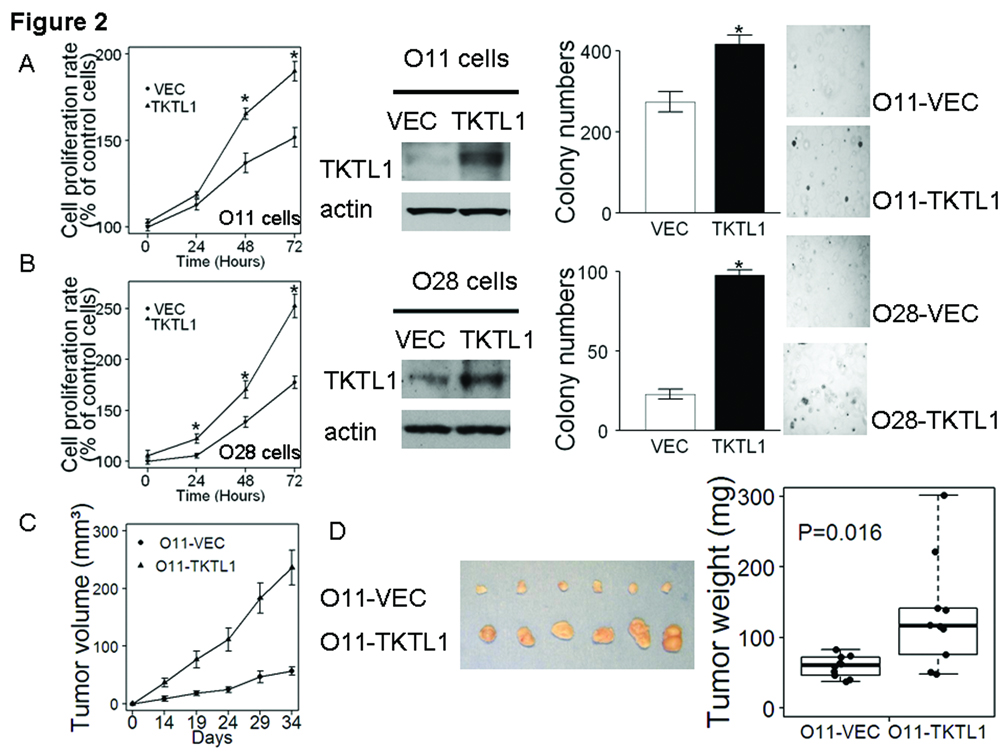
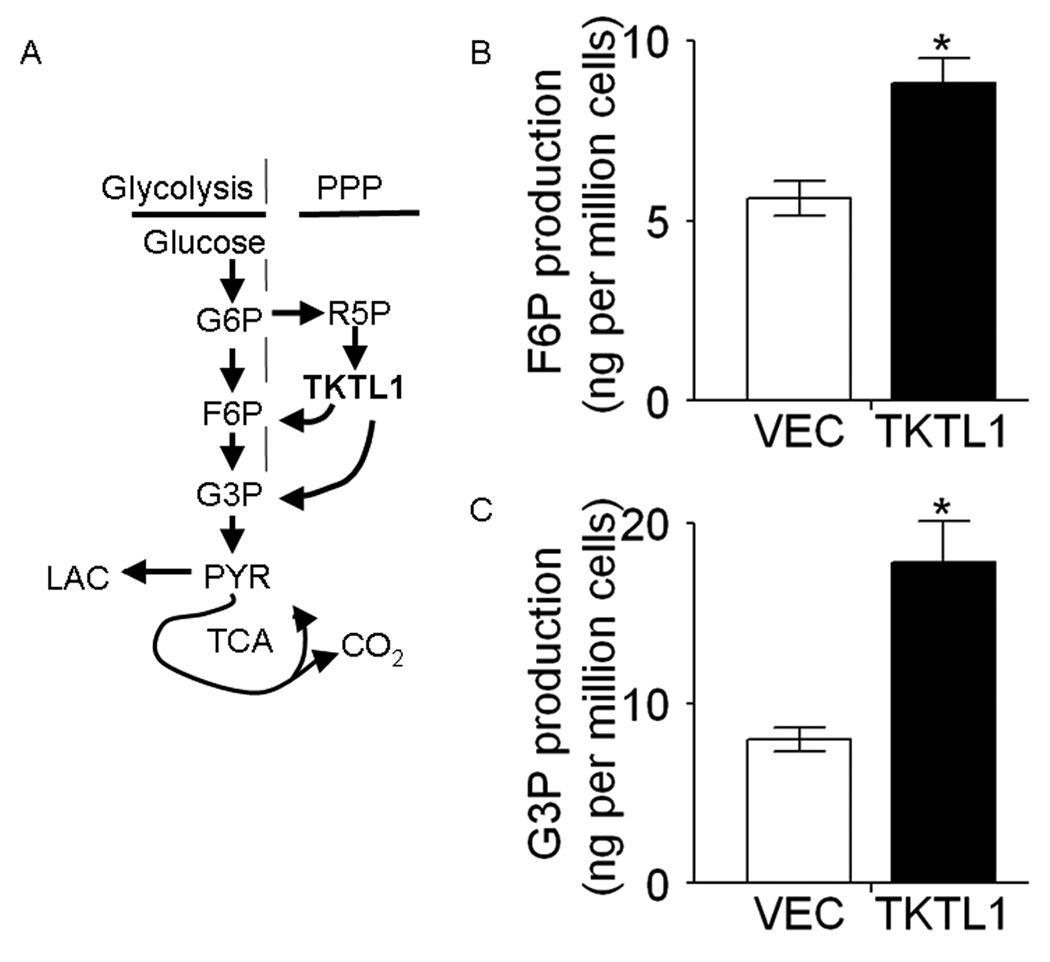
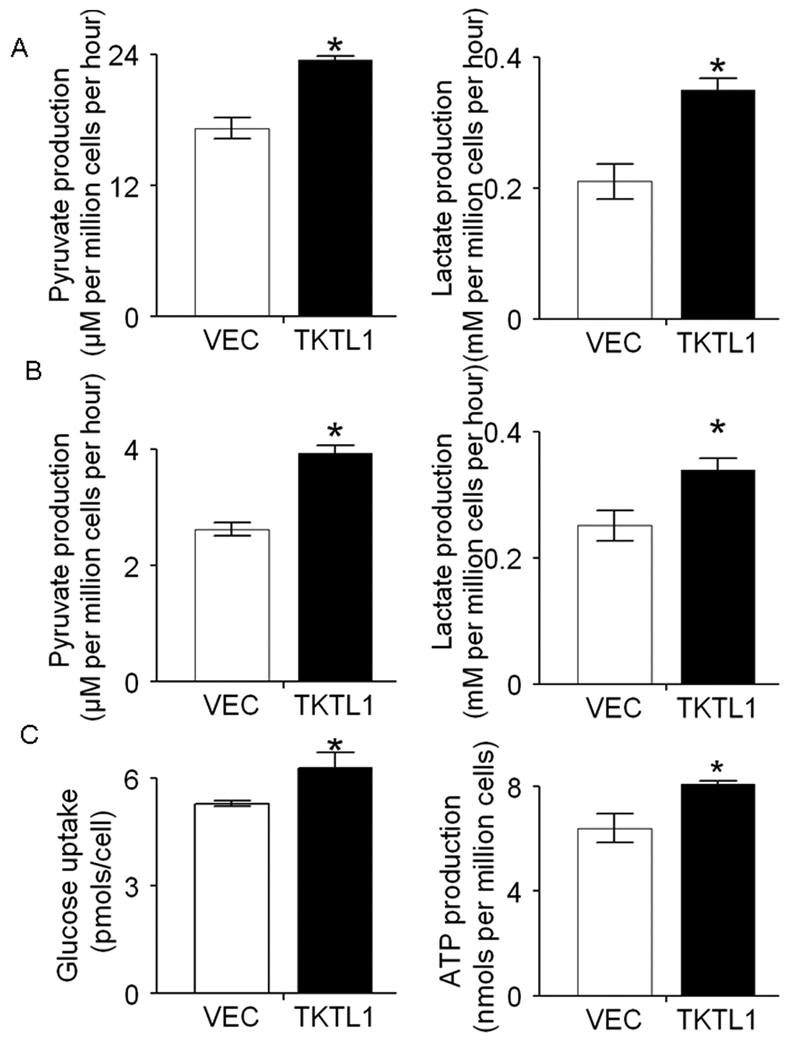
Results: TKTL1 exhibits high frequency of promoter hypomethylation in HNSCC tumors compared with the normal mucosas, correlating with its overexpression in HNSCC. Overexpression of TKTL1 in HNSCC cells promoted cellular proliferation and enhanced tumor growth in vitro and in vivo. Overexpression of TKTL1 increased the production of fructose-6-phosphate and glyceraldehyde-3-phosphate, in turn elevating the production of pyruvate and lactate, resulting in the normoxic stabilization of the malignancy-promoting transcription factor HIF1alpha and the upregulation of downstream glycolytic enzymes. Notably, the reduction of TKTL1 expression decreased HIF1alpha accumulation and inhibition with HIF1alpha and/or the glycolysis inhibitor could abrogate the growth effects mediated by TKTL1 overexpression.
Conclusion: TKTL1 is a novel candidate oncogene that is epigenetically activated by aberrant hypomethlation and contributes to a malignant phenotype through altered glycolytic metabolism and HIF1alpha accumulation.
Figures
Similar articles
-
Transketolase-like 1 ectopic expression is associated with DNA hypomethylation and induces the Warburg effect in melanoma cells.BMC Cancer. 2016 Feb 22;16:134. doi: 10.1186/s12885-016-2185-5. BMC Cancer. 2016. PMID: 26907172 Free PMC article.
-
Mitochondrial mutations contribute to HIF1alpha accumulation via increased reactive oxygen species and up-regulated pyruvate dehydrogenease kinase 2 in head and neck squamous cell carcinoma.Clin Cancer Res. 2009 Jan 15;15(2):476-84. doi: 10.1158/1078-0432.CCR-08-0930. Clin Cancer Res. 2009. PMID: 19147752 Free PMC article.
-
Decreased expression of GRIM-19 by DNA hypermethylation promotes aerobic glycolysis and cell proliferation in head and neck squamous cell carcinoma.Oncotarget. 2015 Jan 1;6(1):101-15. doi: 10.18632/oncotarget.2684. Oncotarget. 2015. PMID: 25575809 Free PMC article.
-
Chronic CSE treatment induces the growth of normal oral keratinocytes via PDK2 upregulation, increased glycolysis and HIF1α stabilization.PLoS One. 2011 Jan 19;6(1):e16207. doi: 10.1371/journal.pone.0016207. PLoS One. 2011. PMID: 21283817 Free PMC article.
-
Glucose Metabolism and Glucose Transporters in Head and Neck Squamous Cell Carcinoma.Cancer Invest. 2024 Nov;42(10):827-844. doi: 10.1080/07357907.2024.2407424. Epub 2024 Sep 26. Cancer Invest. 2024. PMID: 39324504 Review.
Cited by
-
Transient elevation of glycolysis confers radio-resistance by facilitating DNA repair in cells.BMC Cancer. 2015 May 1;15:335. doi: 10.1186/s12885-015-1368-9. BMC Cancer. 2015. PMID: 25925410 Free PMC article.
-
Evaluation of a biomarker based blood test for monitoring surgical resection of oral squamous cell carcinomas.Clin Oral Investig. 2016 Mar;20(2):329-38. doi: 10.1007/s00784-015-1518-0. Epub 2015 Jul 8. Clin Oral Investig. 2016. PMID: 26153867
-
Mechanisms Governing Metabolic Heterogeneity in Breast Cancer and Other Tumors.Front Oncol. 2021 Sep 23;11:700629. doi: 10.3389/fonc.2021.700629. eCollection 2021. Front Oncol. 2021. PMID: 34631530 Free PMC article. Review.
-
FLT4/VEGFR3 activates AMPK to coordinate glycometabolic reprogramming with autophagy and inflammasome activation for bacterial elimination.Autophagy. 2022 Jun;18(6):1385-1400. doi: 10.1080/15548627.2021.1985338. Epub 2021 Oct 10. Autophagy. 2022. PMID: 34632918 Free PMC article.
-
Epitope Detection in Monocytes (EDIM) As a New Method of Liquid Biopsy in Pediatric Rhabdomyosarcoma.Biomedicines. 2022 Jul 28;10(8):1812. doi: 10.3390/biomedicines10081812. Biomedicines. 2022. PMID: 36009359 Free PMC article.
References
-
- Carvalho AL, Jeronimo C, Kim MM, et al. Evaluation of promoter hypermethylation detection in body fluids as a screening/diagnosis tool for head and neck squamous cell carcinoma. Clin Cancer Res. 2008;14:97–107. - PubMed
-
- Feinberg AP, Tycko B. The history of cancer epigenetics. Nat Rev Cancer. 2004;4:143–153. - PubMed
-
- Hanada M, Delia D, Aiello A, Stadtmauer E, Reed JC. bcl-2 gene hypomethylation and high-level expression in B-cell chronic lymphocytic leukemia. Blood. 1993;82:1820–1828. - PubMed
-
- Nishigaki M, Aoyagi K, Danjoh I, et al. Discovery of aberrant expression of R-RAS by cancer-linked DNA hypomethylation in gastric cancer using microarrays. Cancer Res. 2005;65:2115–2124. - PubMed
Publication types
MeSH terms
Substances
Grants and funding
LinkOut - more resources
Full Text Sources
Other Literature Sources
Medical
Research Materials
