

Gene expression of the liver in response to chronic hypoxia
- PMID: 20103700
- PMCID: PMC2869108
- DOI: 10.1152/physiolgenomics.00075.2009
Gene expression of the liver in response to chronic hypoxia
Abstract
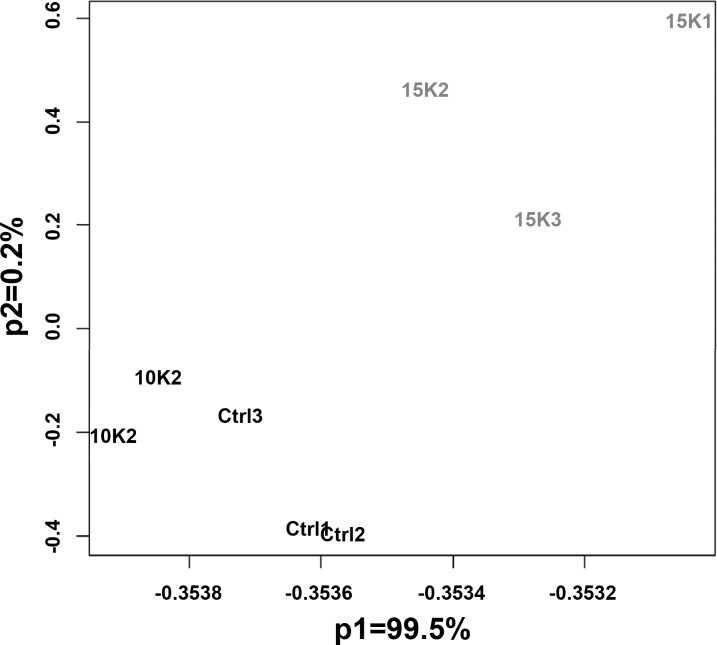
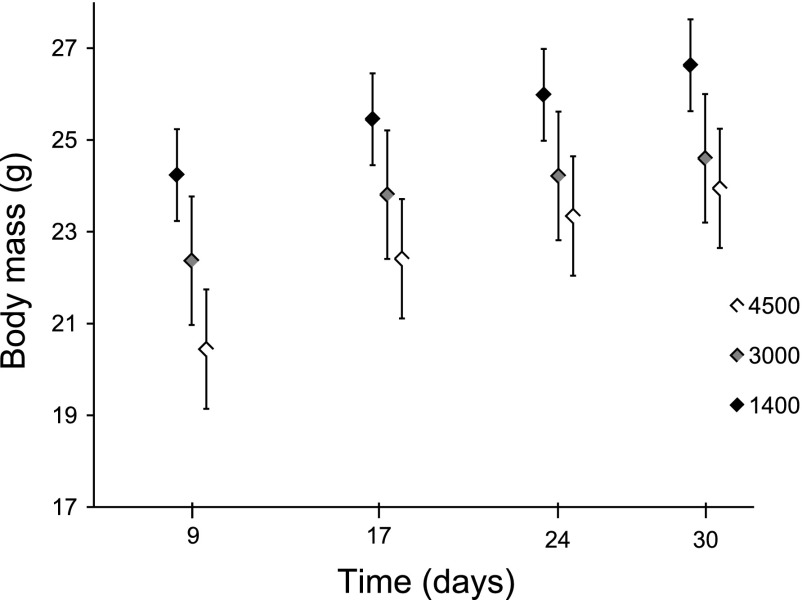
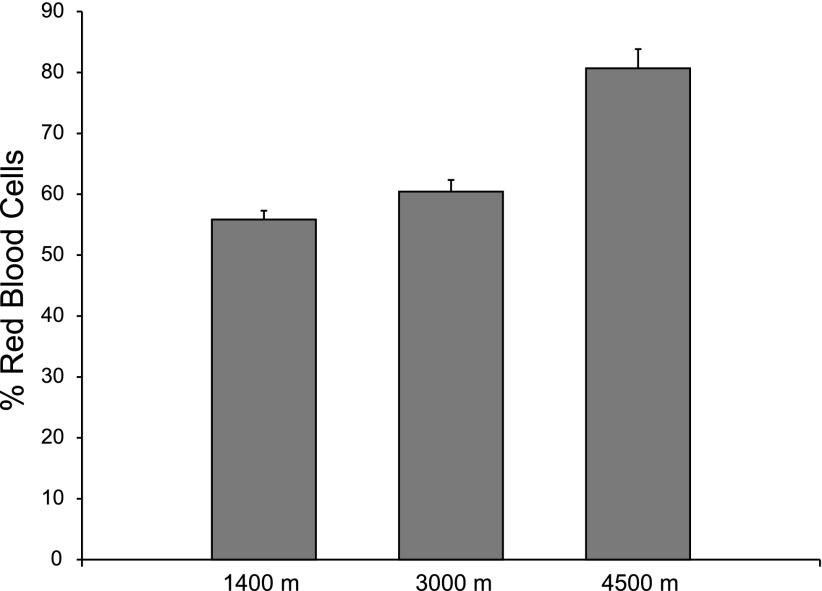
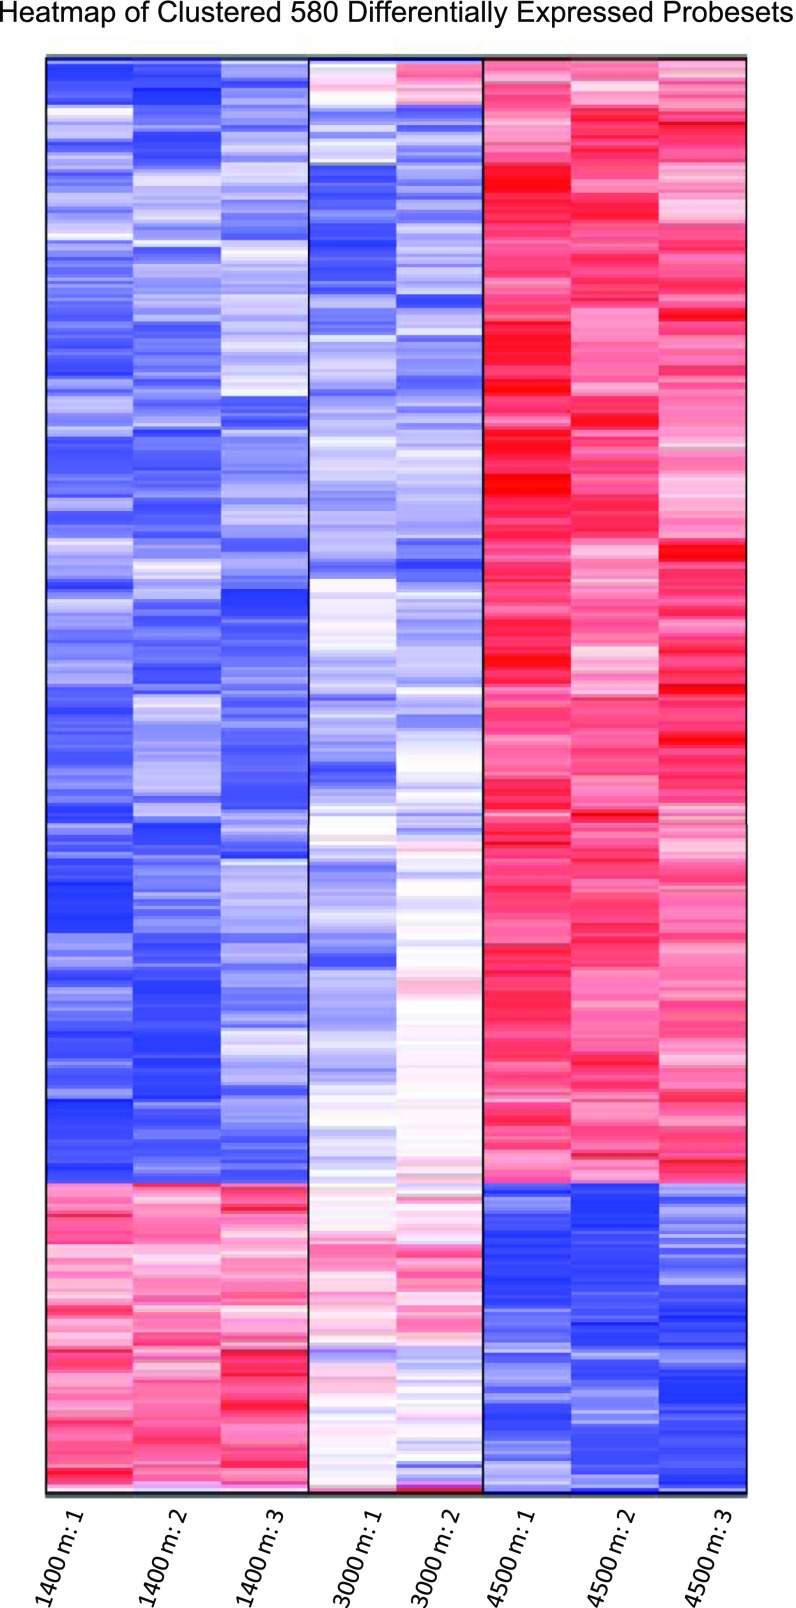
Hypoxia is an important ecological, evolutionary, and biomedical stressor. While physiological acclimatization of mammals to hypoxia is well studied, the variation in gene expression that underlies acclimatization is not well studied. We acclimatized inbred mice for 32 days to hypoxic conditions that simulated altitudes of 1400, 3000, and 4500 m. We used oligonucleotide microarrays to measure changes in steady-state abundance of mRNA in the livers of these mice. Mice exposed to more severe hypoxia (simulated altitude of 4500 m) were smaller in mass and had higher hematocrit than mice exposed to less severe hypoxia. ANOVA and false discovery rate tests indicated that 580 genes were significantly differentially expressed in response to chronic hypoxia. Few of these 580 genes have previously been reported to respond to hypoxia. In contrast, many of these 580 genes belonged to same functional groups typically respond to acute hypoxia. That is, both chronic and acute hypoxia elicit changes in transcript abundance for genes involved in angiogenesis, glycolysis, lipid metabolism, carbohydrate metabolism, and protein amino acid phosphorylation, but the particular genes affected by the two types of hypoxia were mostly different. Numerous genes affecting the immune system were differentially expressed in response to chronic hypoxia, which supports recently proposed hypotheses that link immune function and hypoxia. Furthermore, our results discovered novel elevated mRNA abundance of genes involved in hematopoiesis and oxygen transport not reported previously, but consistent with extreme hematocrits found in hypoxic mice.
Keywords: Mus musculus; hematopoiesis; immune system; leptin receptor; microarray.
Figures
References
-
- Aaron EA, Powell FL. Effect of chronic hypoxia on hypoxic ventilatory response in awake rats. J Appl Physiol 74: 1635–1640, 1993. - PubMed
-
- Ahima RS, Flier JS. Leptin. Annu Rev Physiol 62: 413–437, 2000. - PubMed
-
- Ashburner M, Ball CA, Blake JA, Botstein D, Butler H, Cherry JM, Davis AP, Dolinski K, Dwight SS, Eppig JT, Harris MA, Hill DP, Issel-Tarver L, Kasarskis A, Lewis S, Matese JC, Richardson JE, Ringwald M, Rubin GM, Sherlock G. Gene ontology: tool for the unification of biology. The Gene Ontology Consortium. Nat Genet 25: 25–29, 2000. - PMC - PubMed
-
- Baker M, Candinas D, Stroka DM. Activation of HIF-1 in primary human hepatocytes in response to hypoxia and cytokine stimulation. Hepatology 38: 590A–591A, 2003.
-
- Basnyat B, Cumbo TA, Edelman R. Infections at high altitude. Clin Infect Dis 33: 1887–1891, 2001. - PubMed
Publication types
MeSH terms
Substances
Grants and funding
LinkOut - more resources
Full Text Sources
Molecular Biology Databases