

The protective role of Nrf2 in streptozotocin-induced diabetic nephropathy
- PMID: 20103708
- PMCID: PMC2844833
- DOI: 10.2337/db09-1342
The protective role of Nrf2 in streptozotocin-induced diabetic nephropathy
Abstract
Objective: Diabetic nephropathy is one of the major causes of renal failure, which is accompanied by the production of reactive oxygen species (ROS). Nrf2 is the primary transcription factor that controls the antioxidant response essential for maintaining cellular redox homeostasis. Here, we report our findings demonstrating a protective role of Nrf2 against diabetic nephropathy.
Research design and methods: We explore the protective role of Nrf2 against diabetic nephropathy using human kidney biopsy tissues from diabetic nephropathy patients, a streptozotocin-induced diabetic nephropathy model in Nrf2(-/-) mice, and cultured human mesangial cells.
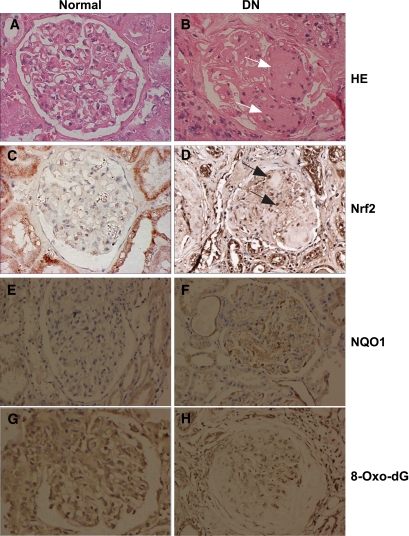
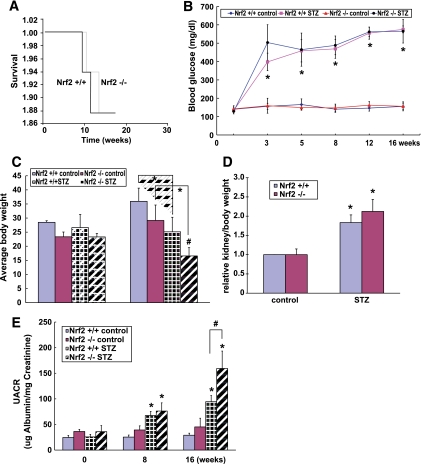
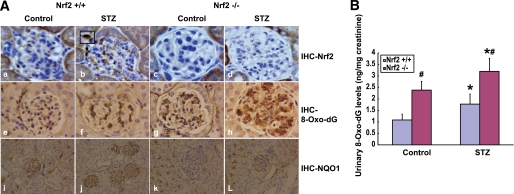
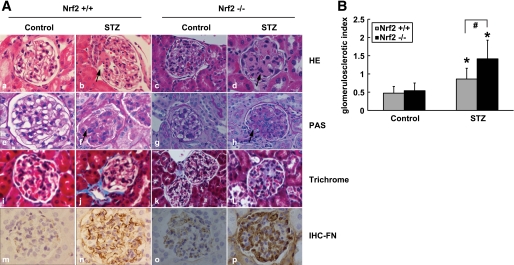
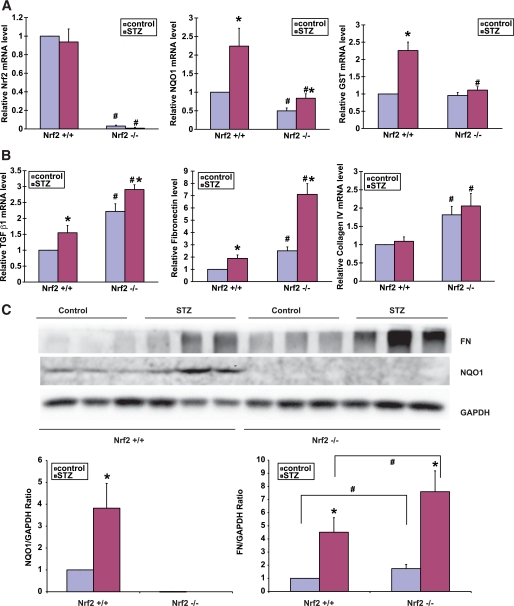
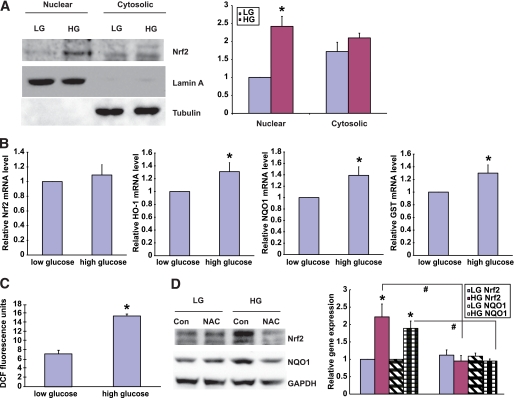
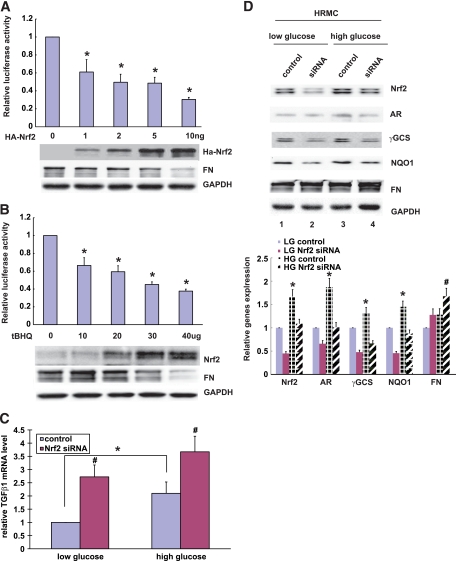
Results: The glomeruli of human diabetic nephropathy patients were under oxidative stress and had elevated Nrf2 levels. In the animal study, Nrf2 was demonstrated to be crucial in ameliorating streptozotocin-induced renal damage. This is evident by Nrf2(-/-) mice having higher ROS production and suffering from greater oxidative DNA damage and renal injury compared with Nrf2(+/+) mice. Mechanistic studies in both in vivo and in vitro systems showed that the Nrf2-mediated protection against diabetic nephropathy is, at least, partially through inhibition of transforming growth factor-beta1 (TGF-beta1) and reduction of extracellular matrix production. In human renal mesangial cells, high glucose induced ROS production and activated expression of Nrf2 and its downstream genes. Furthermore, activation or overexpression of Nrf2 inhibited the promoter activity of TGF-beta1 in a dose-dependent manner, whereas knockdown of Nrf2 by siRNA enhanced TGF-beta1 transcription and fibronectin production.
Conclusions: This work clearly indicates a protective role of Nrf2 in diabetic nephropathy, suggesting that dietary or therapeutic activation of Nrf2 could be used as a strategy to prevent or slow down the progression of diabetic nephropathy.
Figures
Similar articles
-
Therapeutic potential of Nrf2 activators in streptozotocin-induced diabetic nephropathy.Diabetes. 2011 Nov;60(11):3055-66. doi: 10.2337/db11-0807. Diabetes. 2011. PMID: 22025779 Free PMC article.
-
Sirt1 resists advanced glycation end products-induced expressions of fibronectin and TGF-β1 by activating the Nrf2/ARE pathway in glomerular mesangial cells.Free Radic Biol Med. 2013 Dec;65:528-540. doi: 10.1016/j.freeradbiomed.2013.07.029. Epub 2013 Jul 24. Free Radic Biol Med. 2013. PMID: 23891678
-
Potential role for Nrf2 activation in the therapeutic effect of MG132 on diabetic nephropathy in OVE26 diabetic mice.Am J Physiol Endocrinol Metab. 2013 Jan 1;304(1):E87-99. doi: 10.1152/ajpendo.00430.2012. Epub 2012 Nov 6. Am J Physiol Endocrinol Metab. 2013. PMID: 23132297
-
Sestrin2 Signaling Pathway Regulates Podocyte Biology and Protects against Diabetic Nephropathy.J Diabetes Res. 2023 Feb 10;2023:8776878. doi: 10.1155/2023/8776878. eCollection 2023. J Diabetes Res. 2023. PMID: 36818747 Free PMC article. Review.
-
Prevention of diabetic complications by activation of Nrf2: diabetic cardiomyopathy and nephropathy.Exp Diabetes Res. 2012;2012:216512. doi: 10.1155/2012/216512. Epub 2012 May 8. Exp Diabetes Res. 2012. PMID: 22645602 Free PMC article. Review.
Cited by
-
Long non-coding RNA MALAT1 plays a protective role in bronchopulmonary dysplasia via the inhibition of apoptosis and interaction with the Keap1/Nrf2 signal pathway.Transl Pediatr. 2021 Feb;10(2):265-275. doi: 10.21037/tp-20-200. Transl Pediatr. 2021. PMID: 33708512 Free PMC article.
-
Protective Effects of Berberine on Renal Injury in Streptozotocin (STZ)-Induced Diabetic Mice.Int J Mol Sci. 2016 Aug 12;17(8):1327. doi: 10.3390/ijms17081327. Int J Mol Sci. 2016. PMID: 27529235 Free PMC article.
-
Catalase prevents maternal diabetes-induced perinatal programming via the Nrf2-HO-1 defense system.Diabetes. 2012 Oct;61(10):2565-74. doi: 10.2337/db12-0248. Epub 2012 Jun 25. Diabetes. 2012. PMID: 22733796 Free PMC article.
-
C66 ameliorates diabetic nephropathy in mice by both upregulating NRF2 function via increase in miR-200a and inhibiting miR-21.Diabetologia. 2016 Jul;59(7):1558-1568. doi: 10.1007/s00125-016-3958-8. Epub 2016 Apr 26. Diabetologia. 2016. PMID: 27115417 Free PMC article.
-
Stabilization of endogenous Nrf2 by minocycline protects against Nlrp3-inflammasome induced diabetic nephropathy.Sci Rep. 2016 Oct 10;6:34228. doi: 10.1038/srep34228. Sci Rep. 2016. PMID: 27721446 Free PMC article.
References
-
- Ismail N, Becker B, Strzelczyk P, Ritz E: Renal disease and hypertension in non-insulin-dependent diabetes mellitus. Kidney Int 1999; 55: 1– 28 - PubMed
-
- Cooper ME: Pathogenesis, prevention, and treatment of diabetic nephropathy. Lancet 1998; 352: 213– 219 - PubMed
-
- Zheng F, Guan Y: Thiazolidinediones: a novel class of drugs for the prevention of diabetic nephropathy? Kidney Int 2007; 72: 1301– 1303 - PubMed
-
- Debnam ES, Unwin RJ: Hyperglycemia and intestinal and renal glucose transport: implications for diabetic renal injury. Kidney Int 1996; 50: 1101– 1109 - PubMed
Publication types
MeSH terms
Substances
Grants and funding
LinkOut - more resources
Full Text Sources
Medical
Molecular Biology Databases
