. 2010 Jan 26;3(106):ra7.
doi: 10.1126/scisignal.2000514.

A crucial role for RACK1 in the regulation of glucose-stimulated IRE1alpha activation in pancreatic beta cells

Affiliations

A crucial role for RACK1 in the regulation of glucose-stimulated IRE1alpha activation in pancreatic beta cells

Yifu Qiu et al. Sci Signal. .

Abstract

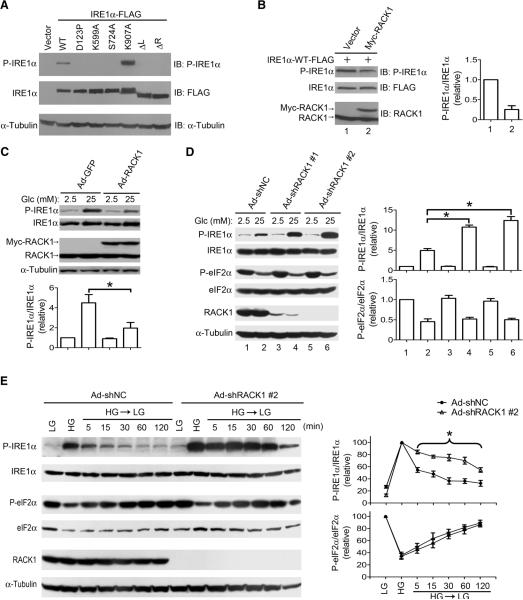
Autophosphorylation of inositol-requiring enzyme 1alpha (IRE1alpha) is required for its activation, which elicits the cellular unfolded protein response (UPR) and is functionally connected with insulin biosynthesis in pancreatic beta cells. We found that the scaffold protein receptor for activated C-kinase 1 (RACK1) interacted with IRE1alpha in a glucose-stimulated or endoplasmic reticulum (ER) stress-responsive manner in pancreatic beta cells and primary islets. RACK1 mediated the glucose-inducible assembly of a complex containing IRE1alpha, RACK1, and protein phosphatase 2A (PP2A) to promote dephosphorylation of IRE1alpha by PP2A, thereby inhibiting glucose-stimulated IRE1alpha activation and attenuating IRE1alpha-dependent increases in insulin production. Moreover, IRE1alpha activation was increased and RACK1 abundance was decreased in a mouse model of diabetes. Thus, our findings demonstrate that RACK1 functions as a key component in regulating the IRE1alpha signaling pathway in pancreatic beta cells.


Figures

Fig. 1
Fig. 1. Glucose or ER stress induces the endogenous IRE1α-RACK1 interaction in β-cells
(A to C) INS-1 832/3 β-cells maintained in 5 mM glucose (Glc) for 18 hours were cultured for 3 hours in medium with glucose at 2.5, 16.7, or 25 mM (A), or treated with DMSO, thapsigargin (Tg, 2 μM), or tunicamycin (Tm, 10 μg/ml) for 1 or 3 hours (B), or cultured for 3 hours in medium with glucose at the indicated concentrations ranging from 2.5 to 16.7 mM (C). Immunoprecipitation was performed with anti-RACK1. Antibodies against IRE1α, eIF2α, RACK1, and α-tubulin were used for immunoblotting. Phosphorylated IRE1α (P-IRE1α) and eIF2α (P-eIF2α) in cell lysates were detected by antibodies against phospho-Ser724 in IRE1α and phospho-Ser52 in eIF2α, respectively. Results are representative of three (A and B) or two (C) independent experiments.
Fig. 2
Fig. 2. RACK1 attenuates IRE1α phosphorylation
(A) Autophosphorylation of overexpressed IRE1α proteins. Cell lysates from HEK 293T cells transfected with the indicated FLAG-tagged IRE1α constructs were analyzed by immunoblotting with anti-IRE1α [pSer724]. The membrane was stripped and subsequently immunoblotted with an antibody against FLAG. Shown is the representative of two independent experiments. (B) RACK1 overexpression reduces IRE1α phosphorylation. HEK 293T cells were cotransfected with the indicated plasmids and immunoblotting was performed using the indicated antibodies. IRE1α phosphorylation was determined by densitometric quantification of the immunoblots, and the relative ratios of P-IRE1α normalized to total IRE1α are presented as means ± SEM (n=3 independent experiments). (C) Overexpression of RACK1 decreases glucose-stimulated IRE1α phosphorylation in β-cells. INS-1 cells were infected at an MOI of 10 for 48 hours with recombinant adenoviruses expressing GFP or Myc-tagged RACK1. Infected cells maintained in 5 mM glucose for 18 hours were cultured in 2.5 or 25 mM glucose for 3 hours. Relative P-IRE1α/IRE1α ratios were determined from densitometric quantifications of the immunoblots and are shown as means ± SEM (n=3 independent experiments). *P<0.05 compared to Ad-GFP-infected cells cultured in 25 mM glucose by two-way ANOVA. (D) RACK1 deficiency augments glucose-stimulated IRE1α phosphorylation in β-cells. INS-1 cells were infected at an MOI of 40 for 72 hours with adenoviruses Ad-shNC, Ad-shRACK1 #1, or Ad-shRACK1 #2. Cells were subsequently maintained in 5 mM glucose for 18 hours, followed by incubation with 2.5 or 25 mM glucose for 3 hours. Relative P-IRE1α/IRE1α and P-eIF2α/eIF2α ratios are shown as means ± SEM (n=3 independent experiments). *P<0.05 compared to Ad-shNC-infected cells cultured in 25 mM glucose by two-way ANOVA. (E) Knockdown of RACK1 attenuates dephosphorylation of IRE1α after β cells are shifted from high to low glucose conditions. INS-1 cells were infected with adenoviruses Ad-shNC or Ad-shRACK1 #2. Cells were either maintained in low glucose (LG) at 2.5 mM for 3 hours or stimulated with 25 mM high glucose (HG) for 3 hours, then incubated in 2.5 mM glucose for the indicated time intervals. Changes in the relative ratios of P-IRE1α/IRE1α and P-eIF2α/eIF2α, which were normalized to their respective HG controls (which were set at 100), were tracked over the indicated time period, and are shown as means ± SEM (n=3 independent experiments). *P<0.05 compared to the Ad-shNC control by two-way ANOVA.
Fig. 3
Fig. 3. RACK1 promotes IRE1α dephosphorylation through PP2A
(A) Overexpression of PP2A reduces IRE1α autophosphorylation. Plasmids encoding HA-tagged PP1c, PP2A, or PP2C were co-transfected with FLAG-tagged wild-type IRE1α into HEK 293T cells. IRE1α phosphorylation was analyzed by immunoblotting at 48 hours post-transfection. The expression of PP1c, PP2A, or PP2C was detected by anti-HA. Relative P-IRE1α/IRE1α ratios are shown as means ± SEM (n=3 independent experiments). *P<0.05 compared to the vector control by one-way ANOVA. (B) Adenoviral overexpression of PP2A decreases glucose-induced IRE1α phosphorylation in β-cells. INS-1 cells infected at an MOI of 10 for 48 hours with adenoviruses expressing GFP or PP2A were maintained in 5 mM glucose for 18 hours and then cultured in 2.5 or 25 mM glucose for 3 hours. Relative P-IRE1α/IRE1α ratios are presented as means ± SEM (n=3 independent experiments). *P<0.05 compared to Ad-GFP-infected cells cultured in 25 mM glucose by two-way ANOVA. (C) Okadaic acid (OA) inhibits dephosphorylation of IRE1α, but not eIF2α, in β-cells shifted from high to low glucose conditions (HG → LG). INS-1 cells maintained with 5 mM glucose for 18 hours were cultured with low glucose (LG) at 2.5 mM or high glucose (HG) at 25 mM glucose for 3 hours, followed by incubation in fresh medium for another 2 hours (compare lane 1 to lane 2); cells pre-treated with 25 mM glucose for 3 hours were then incubated in medium with 2.5 mM glucose in the presence of increasing concentrations of OA for 2 hours as indicated (lanes 3 to 8). Relative P-IRE1α/IRE1α and P-eIF2α/eIF2α ratios are shown as means ± SEM (n=3 independent experiments). *P<0.05 compared to cells cultured with low glucose by one-way ANOVA. (D) RACK1 associates with both IRE1α and PP2A. Plasmids encoding HA-tagged PP2A or PP2C were cotransfected with FLAG-tagged WT IRE1α into HEK 293T cells. Immunoprecipitation was performed at 48 hours post-transfection with anti-RACK1, followed by immunoblotting with antibodies against FLAG, HA, or RACK1. Results are representative of two independent experiments.
Fig. 4
Fig. 4. RACK1 regulates IRE1α phosphorylation through altered assembly of an IRE1α-RACK1-PP2A complex
(A) RACK1 is essential for glucose-stimulated formation of a ternary IRE1α-RACK1-PP2A complex. INS-1 cells were infected at an MOI of 40 for 72 hours with adenoviruses Ad-shNC or Ad-shRACK1 #2. Following pre-culture in 5 mM glucose for 18 hours, cells were incubated in 2.5 mM or 25 mM glucose for 3 hours. Immunoprecipitation was performed using anti-PP2A, followed by immunoblotting with the desired antibodies. Results represent three independent experiments. (B) The dissocation of PP2A from RACK1, as induced by ER stress, causes the retention of RACK1-associated IRE1α phosphorylation in INS-1 β-cells and islets. INS-1 cells maintained in 5 mM glucose for 18 hours were treated with DMSO, thapsigargin (Tg, 2 μM), tunicamycin (Tm, 10 μg/ml), or high glucose (HG, 25 mM). Pancreatic islets isolated from 28 male C57BL/6 mice were pooled and maintained in 5 mM glucose for 18 hours, and were subsequently treated for 3 hours with thapsigargin (Tg, 2 μM) or high glucose (HG, 25 mM). Immunoprecipitation was performed with anti-RACK1, and immunoblotting was conducted using the indicated antibodies. Shown is the representative result of two independent experiments for INS-1 cells or pancreatic islets. (C) Chronic exposure to high glucose causes the dissociation of PP2A from RACK1 and sustained phosphorylation of RACK1-associated IRE1α in β-cells. INS-1 cells pre-cultured in 5 mM glucose were maintained in 2.5 mM glucose for 3 hours or in 25 mM glucose for 3 or 72 hours. Immunoprecipitation was performed using anti-RACK1, followed by immunoblotting with the indicated antibodies. Results represent three independent experiments.
Fig. 5
Fig. 5. RACK1 antagonizes IRE1α-dependent upregulation of insulin production in β-cells
(A) Overexpression of RACK1 in β-cells attenuates the IRE1α phosphorylation-dependent increase in the intracellular insulin content. INS-1 cells maintained in 11.1 mM glucose were infected with control adenovirus Ad-GFP (at an MOI of 20), or co-infected at a total MOI of 20 with Ad-GFP (at an MOI of 10) plus viruses expressing the indicated forms of IRE1α, Ad-RACK1, or Ad-IRE1α-WT with Ad-RACK1. Cell lysates were analyzed by immunoblotting at 48 hours post-infection using the indicated antibodies. Intracellular insulin content was measured by radioactive immunoassay (RIA) and values are shown as means ± SEM (n=3 independent experiments). *P<0.05 compared to Ad-GFP-infected control cells, and #P<0.05 compared to cells infected with Ad-IRE1α by one-way ANOVA. (B) RACK1 knockdown increases IRE1α phosphorylation and insulin content in β-cells. INS-1 cells maintained in 11.1 mM glucose were infected at an MOI of 40 with Ad-shNC, Ad-shRACK1 #1, or Ad-shRACK1 #2. Intracellular insulin content was determined and is shown as means ± SEM (n=3 independent experiments). *P<0.05 compared to the Ad-shNC control by one-way ANOVA. (C) Adenoviral RACK1 overexpression reduces IRE1α phosphorylation and insulin content in mouse pancreatic islets. Primary islets isolated from 6–8 male C57BL/6 mice were pooled and infected at an MOI of 100 (with the assumption of 2500 cells/islet) by Ad-GFP or Ad-RACK1 for 48 hours. After pre-culture in 5 mM glucose for 18 hours, islets were incubated in 25 mM glucose for 3 hours prior to immunoblotting analysis. Insulin content was measured and are shown as means ± SEM (n=3 independent experiments). *P<0.05 by unpaired two-tailed t-test. (D) Restored expression of RACK1 reduces IRE1α phosphorylation and decreases insulin content in the islets of db/db mice. Islets isolated and pooled from 6–7 C57BL/6 db/db mice at 14–16 weeks of age were infected at an MOI of 100 with Ad-GFP or Ad-RACK1 for 48 hours or left uninfected. Uninfected islets from wild-type littermates were used as the control. Immunoblotting and RIA insulin measurement were performed, and insulin contents are shown as means ± SEM (n=3 independent experiments). *P<0.05 by unpaired two-tailed t-test.
Fig. 6
Fig. 6. Schematic model for RACK1 acting as a crucial regulatory adaptor within the IRE1α signaling platform in pancreatic β-cells
RACK1 is constitutively associated with PP2A under normal physiological conditions. It interacts with IRE1α in response to acute glucose stimulation, thereby directing PP2A to exert a feedback “brake” control on IRE1α phosphorylation as well as IRE1α-dependent upregulation of insulin biosynthesis. Conversely, ER stress or prolonged exposure to high glucose causes RACK1 to dissociate from PP2A, resulting in disruption of this tripartite regulatory module. In this scenario, the retained phosphorylation of RACK1-associated IRE1α may exert altered functional outputs during the cellular UPR.

References

    1. Ron D, Walter P. Signal integration in the endoplasmic reticulum unfolded protein response. Nat Rev Mol Cell Biol. 2007;8:519–529. - PubMed
    1. Cox JS, Shamu CE, Walter P. Transcriptional induction of genes encoding endoplasmic reticulum resident proteins requires a transmembrane protein kinase. Cell. 1993;73:1197–1206. - PubMed
    1. Mori K, Ma W, Gething MJ, Sambrook J. A transmembrane protein with a cdc2+/CDC28− related kinase activity is required for signaling from the ER to the nucleus. Cell. 1993;74:743–756. - PubMed
    1. Yoshida H, Matsui T, Yamamoto A, Okada T, Mori K. XBP1 mRNA is induced by ATF6 and spliced by IRE1 in response to ER stress to produce a highly active transcription factor. Cell. 2001;107:881–891. - PubMed
    1. Calfon M, Zeng H, Urano F, Till JH, Hubbard SR, Harding HP, Clark SG, Ron D. IRE1 couples endoplasmic reticulum load to secretory capacity by processing the XBP-1 mRNA. Nature. 2002;415:92–96. - PubMed

MeSH terms