

Hematopoiesis and its disorders: a systems biology approach
- PMID: 20103779
- PMCID: PMC2845894
- DOI: 10.1182/blood-2009-08-215798
Hematopoiesis and its disorders: a systems biology approach
Abstract
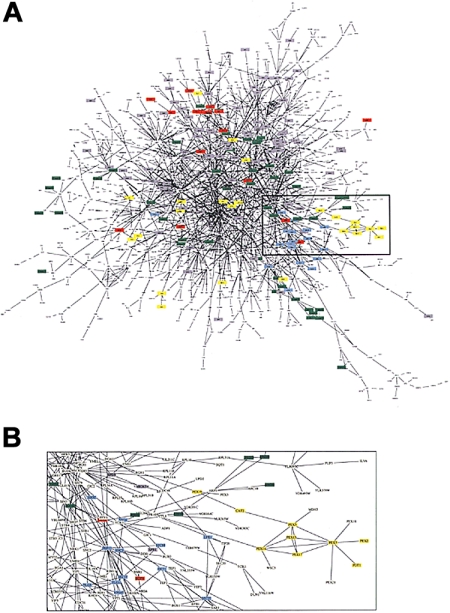
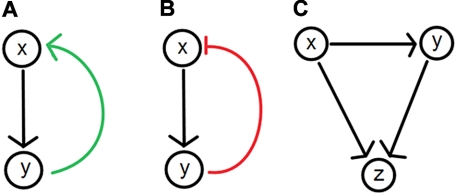
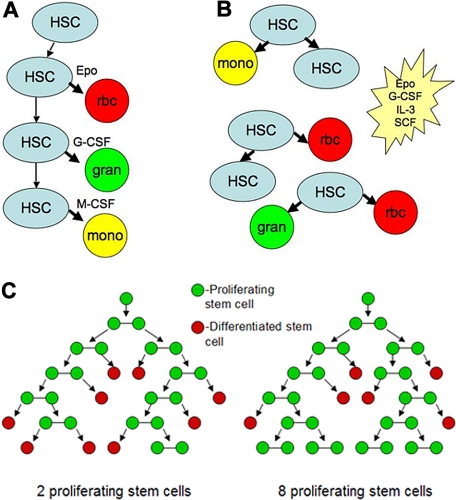
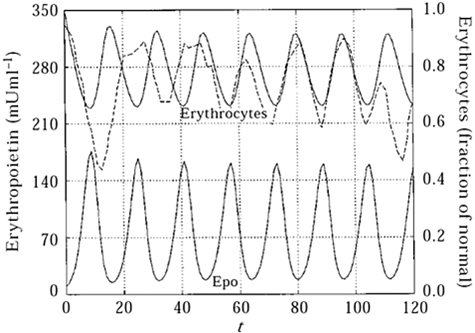
Scientists have traditionally studied complex biologic systems by reducing them to simple building blocks. Genome sequencing, high-throughput screening, and proteomics have, however, generated large datasets, revealing a high level of complexity in components and interactions. Systems biology embraces this complexity with a combination of mathematical, engineering, and computational tools for constructing and validating models of biologic phenomena. The validity of mathematical modeling in hematopoiesis was established early by the pioneering work of Till and McCulloch. In reviewing more recent papers, we highlight deterministic, stochastic, statistical, and network-based models that have been used to better understand a range of topics in hematopoiesis, including blood cell production, the periodicity of cyclical neutropenia, stem cell production in response to cytokine administration, and the emergence of imatinib resistance in chronic myeloid leukemia. Future advances require technologic improvements in computing power, imaging, and proteomics as well as greater collaboration between experimentalists and modelers. Altogether, systems biology will improve our understanding of normal and abnormal hematopoiesis, better define stem cells and their daughter cells, and potentially lead to more effective therapies.
Figures
Similar articles
-
Systems hematology: an introduction.Adv Exp Med Biol. 2014;844:3-10. doi: 10.1007/978-1-4939-2095-2_1. Adv Exp Med Biol. 2014. PMID: 25480634
-
Zebrafish as a model for normal and malignant hematopoiesis.Dis Model Mech. 2011 Jul;4(4):433-8. doi: 10.1242/dmm.006791. Dis Model Mech. 2011. PMID: 21708900 Free PMC article. Review.
-
Periodic haematological diseases: mystical entities or dynamical disorders?J R Coll Physicians Lond. 1989 Oct;23(4):236-41. J R Coll Physicians Lond. 1989. PMID: 2685268 Free PMC article. Review. No abstract available.
-
Cyclical neutropenia and other periodic hematological disorders: a review of mechanisms and mathematical models.Blood. 1998 Oct 15;92(8):2629-40. Blood. 1998. PMID: 9763544 Review.
-
Periodic hematological disorders: Quintessential examples of dynamical diseases.Chaos. 2020 Jun;30(6):063123. doi: 10.1063/5.0006517. Chaos. 2020. PMID: 32611100
Cited by
-
Identification of Altered Primary Immunodeficiency-Associated Genes and Their Implications in Pediatric Cancers.Cancers (Basel). 2022 Nov 30;14(23):5942. doi: 10.3390/cancers14235942. Cancers (Basel). 2022. PMID: 36497424 Free PMC article.
-
Computational Reconstruction of Clonal Hierarchies From Bulk Sequencing Data of Acute Myeloid Leukemia Samples.Front Physiol. 2021 Aug 23;12:596194. doi: 10.3389/fphys.2021.596194. eCollection 2021. Front Physiol. 2021. PMID: 34497529 Free PMC article.
-
Quantitative modeling of chronic myeloid leukemia: insights from radiobiology.Blood. 2012 May 10;119(19):4363-71. doi: 10.1182/blood-2011-09-381855. Epub 2012 Feb 21. Blood. 2012. PMID: 22353999 Free PMC article. Review.
-
Targeted Therapy of FLT3 in Treatment of AML-Current Status and Future Directions.J Clin Med. 2014 Dec 15;3(4):1466-89. doi: 10.3390/jcm3041466. J Clin Med. 2014. PMID: 26237612 Free PMC article. Review.
-
A model to explain specific cellular communications and cellular harmony:- a hypothesis of coupled cells and interactive coupling molecules.Theor Biol Med Model. 2014 Sep 14;11:40. doi: 10.1186/1742-4682-11-40. Theor Biol Med Model. 2014. PMID: 25218581 Free PMC article.
References
-
- Nurse P. Life, logic and information. Nature. 2008;454(7203):424–426. - PubMed
-
- Gilbert SF, Sarkar S. Embracing complexity: organicism for the 21st century. Dev Dyn. 2000;219(1):1–9. - PubMed
-
- Ideker T, Galitski T, Hood L. A new approach to decoding life: systems biology. Annu Rev Genomics Hum Genet. 2001;2:343–372. - PubMed
-
- Alizadeh AA, Eisen MB, Davis RE, et al. Distinct types of diffuse large B-cell lymphoma identified by gene expression profiling. Nature. 2000;403(6769):503–511. - PubMed
-
- Goodman SR, Kurdia A, Ammann L, Kakhniashvili D, Daescu O. The human red blood cell proteome and interactome. Exp Biol Med (Maywood) 2007;232(11):1391–1408. - PubMed
Publication types
MeSH terms
Grants and funding
LinkOut - more resources
Full Text Sources
Medical
