

Chemical address tags of fluorescent bioimaging probes
- PMID: 20104576
- PMCID: PMC2907078
- DOI: 10.1002/cyto.a.20847
Chemical address tags of fluorescent bioimaging probes
Abstract
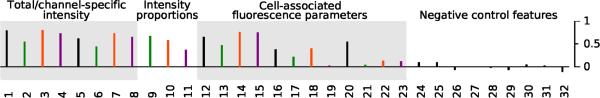
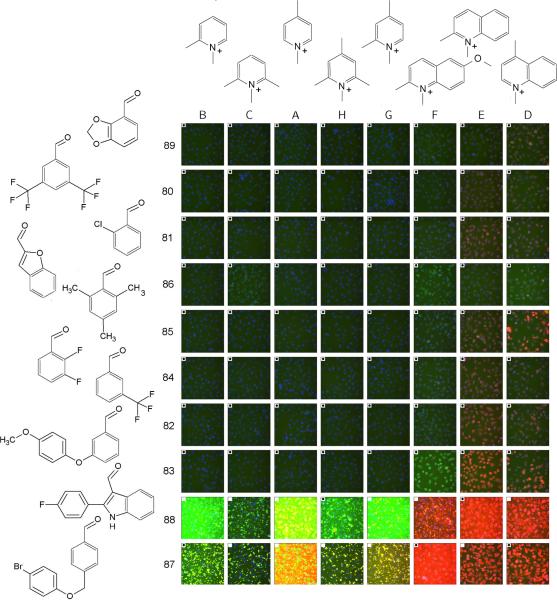
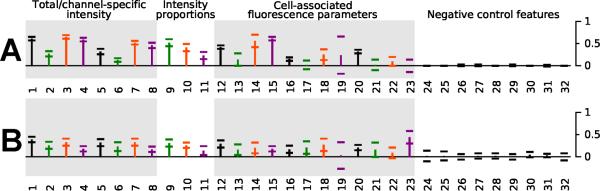
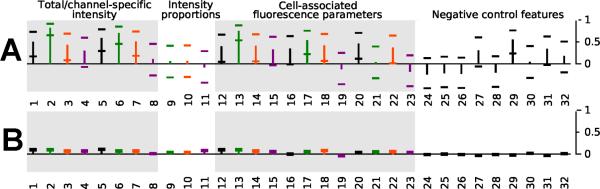
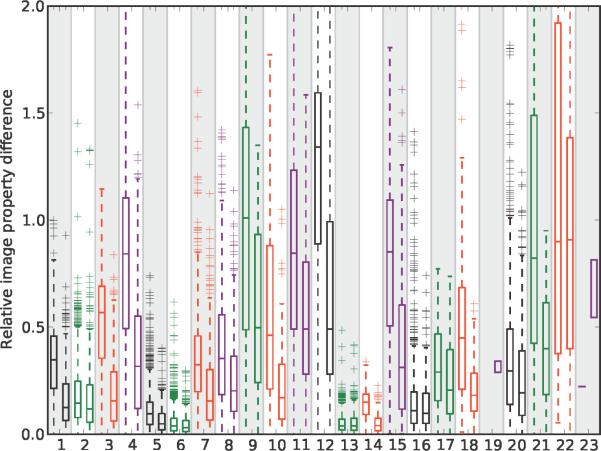
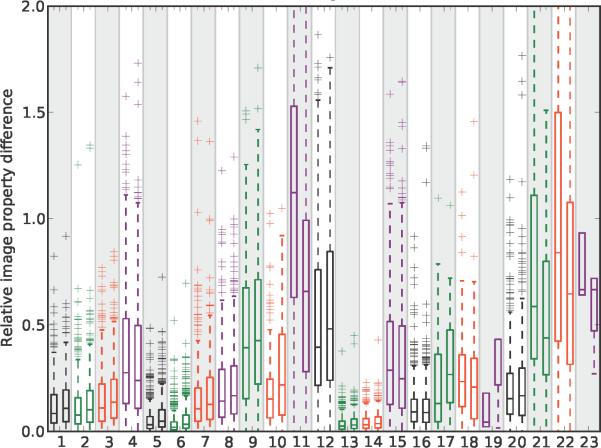
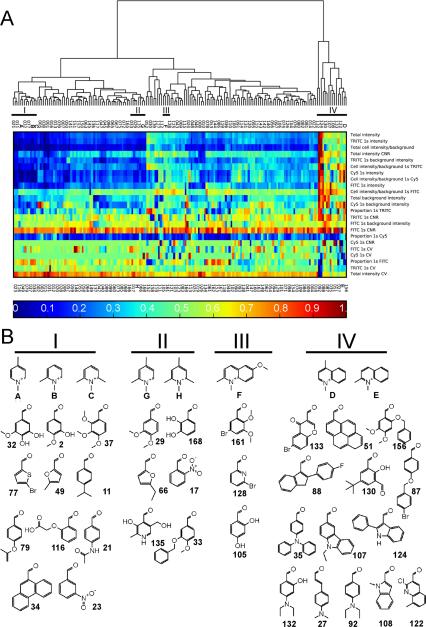
Chemical address tags can be defined as specific structural features shared by a set of bioimaging probes having a predictable influence on cell-associated visual signals obtained from these probes. Here, using a large image dataset acquired with a high content screening instrument, machine vision and cheminformatics analysis have been applied to reveal chemical address tags. With a combinatorial library of fluorescent molecules, fluorescence signal intensity, spectral, and spatial features characterizing each one of the probes' visual signals were extracted from images acquired with the three different excitation and emission channels of the imaging instrument. With multivariate regression, the additive contribution from each one of the different building blocks of the bioimaging probes toward each measured, cell-associated image-based feature was calculated. In this manner, variations in the chemical features of the molecules were associated with the resulting staining patterns, facilitating quantitative, objective analysis of chemical address tags. Hierarchical clustering and paired image-cheminformatics analysis revealed key structure-property relationships amongst many building blocks of the fluorescent molecules. The results point to different chemical modifications of the bioimaging probes that can exert similar (or different) effects on the probes' visual signals. Inspection of the clustered structures suggests intramolecular charge migration or partial charge distribution as potential mechanistic determinants of chemical address tag behavior.
Figures
Similar articles
-
Machine vision-assisted analysis of structure-localization relationships in a combinatorial library of prospective bioimaging probes.Cytometry A. 2009 Jun;75(6):482-93. doi: 10.1002/cyto.a.20713. Cytometry A. 2009. PMID: 19243023 Free PMC article.
-
Prospecting for Live Cell BioImaging Probes With Cheminformatic Assisted Image Arrays (CAIA).Proc IEEE Int Symp Biomed Imaging. 2007:1108-1111. doi: 10.1109/ISBI.2007.357050. Proc IEEE Int Symp Biomed Imaging. 2007. PMID: 23482717 Free PMC article.
-
Molecular Tuning of Styryl Dyes Leads to Versatile and Efficient Plasma Membrane Probes for Cell and Tissue Imaging.Bioconjug Chem. 2020 Mar 18;31(3):875-883. doi: 10.1021/acs.bioconjchem.0c00023. Epub 2020 Feb 26. Bioconjug Chem. 2020. PMID: 32053748
-
Recent Progress in Chemosensors Using Aldehyde-bearing Fluorophores for the Detection of Specific Analytes and their Bioimaging.Curr Med Chem. 2019;26(21):4003-4028. doi: 10.2174/0929867325666180117095528. Curr Med Chem. 2019. PMID: 29345575 Review.
-
Recent Progress in Fluorescent Imaging Probes.Sensors (Basel). 2015 Sep 22;15(9):24374-96. doi: 10.3390/s150924374. Sensors (Basel). 2015. PMID: 26402684 Free PMC article. Review.
Cited by
-
Molecular design of a pathogen activated, self-assembling mechanopharmaceutical device.J Control Release. 2022 Jul;347:620-631. doi: 10.1016/j.jconrel.2022.05.029. Epub 2022 May 28. J Control Release. 2022. PMID: 35623493 Free PMC article. Review.
-
The subcellular distribution of small molecules: from pharmacokinetics to synthetic biology.Mol Pharm. 2011 Oct 3;8(5):1619-28. doi: 10.1021/mp200092v. Epub 2011 Aug 15. Mol Pharm. 2011. PMID: 21805990 Free PMC article. Review.
-
Visualizing chemical structure-subcellular localization relationships using fluorescent small molecules as probes of cellular transport.J Cheminform. 2013 Oct 5;5(1):44. doi: 10.1186/1758-2946-5-44. J Cheminform. 2013. PMID: 24093553 Free PMC article.
-
Computational approaches to analyse and predict small molecule transport and distribution at cellular and subcellular levels.Biopharm Drug Dispos. 2014 Jan;35(1):15-32. doi: 10.1002/bdd.1879. Epub 2013 Dec 10. Biopharm Drug Dispos. 2014. PMID: 24218242 Free PMC article. Review.
References
-
- Loo LH, Wu LF, Altschuler SJ. Image-based multivariate profiling of drug responses from single cells. Nat Methods. 2007;4(5):445–53. - PubMed
-
- Perlman ZE, Slack MD, Feng Y, Mitchison TJ, Wu LF, Altschuler SJ. Multidimensional drug profiling by automated microscopy. Science. 2004;306(5699):1194–8. - PubMed
-
- Wagner BK, Carrinski HA, Ahn YH, Kim YK, Gilbert TJ, Fomina DA, Schreiber SL, Chang YT, Clemons PA. Small-molecule fluorophores to detect cell-state switching in the context of high-throughput screening. J Am Chem Soc. 2008;130(13):4208–9. - PubMed
-
- Lee JW, Jung M, Rosania GR, Chang YT. Development of novel cell-permeable DNA sensitive dyes using combinatorial synthesis and cell-based screening. Chem Commun (Camb) 2003;(15):1852–3. - PubMed
MeSH terms
Substances
Grants and funding
LinkOut - more resources
Full Text Sources
