. 2010 Feb;159(4):772-86.
doi: 10.1111/j.1476-5381.2009.00488.x. Epub 2010 Jan 26.

Influence of fluorophore and linker composition on the pharmacology of fluorescent adenosine A1 receptor ligands

Affiliations

Influence of fluorophore and linker composition on the pharmacology of fluorescent adenosine A1 receptor ligands

Jillian G Baker et al. Br J Pharmacol. 2010 Feb.

Abstract

Background and purpose: The introduction of fluorescence-based techniques, and in particular the development of fluorescent ligands, has allowed the study of G protein-coupled receptor pharmacology at the single cell and single molecule level. This study evaluated how the physicochemical nature of the linker and the fluorophore affected the pharmacological properties of fluorescent agonists and antagonists.

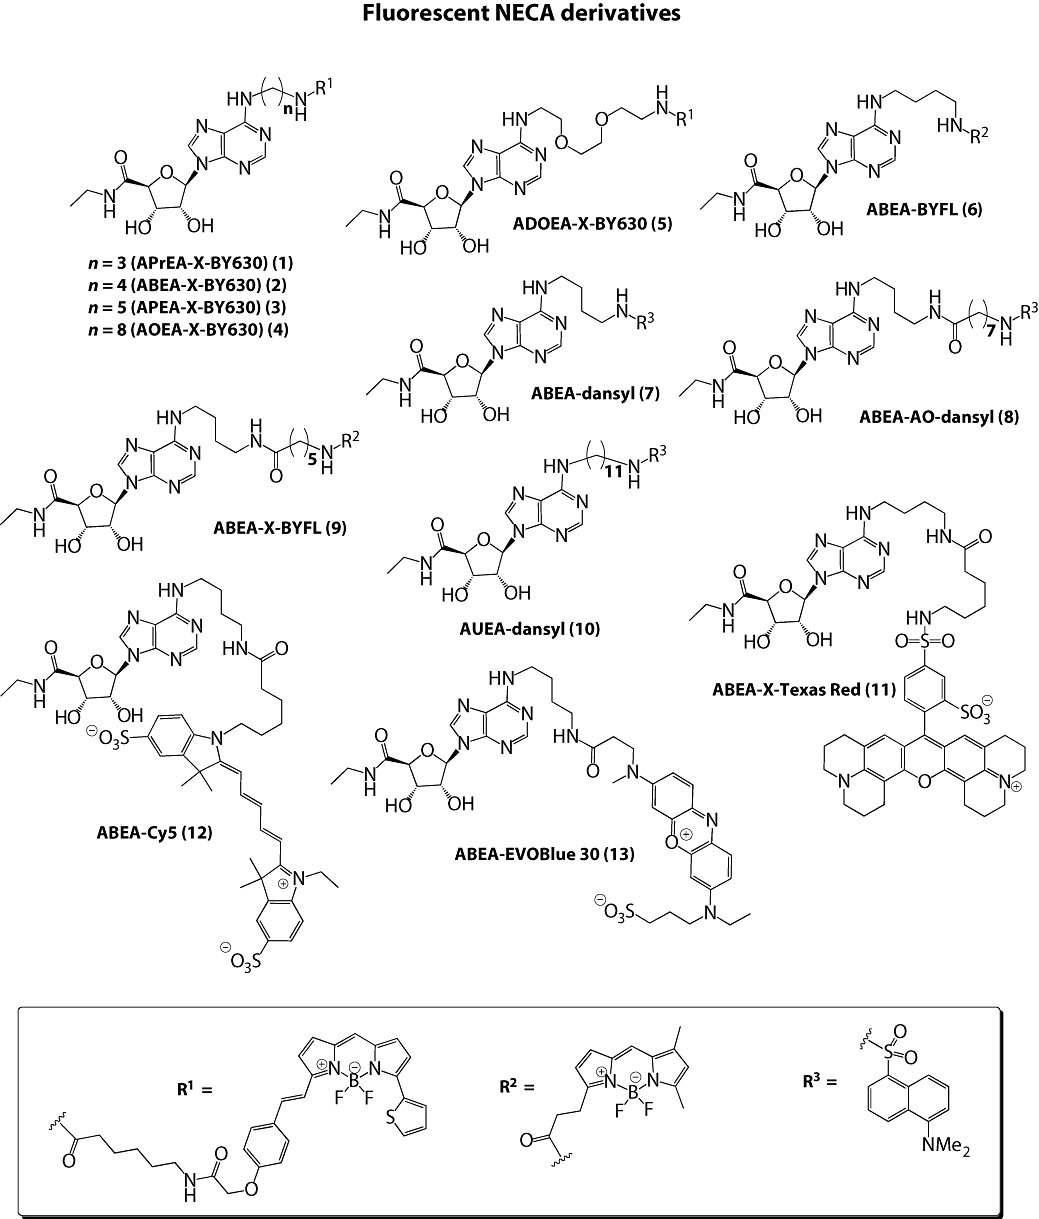
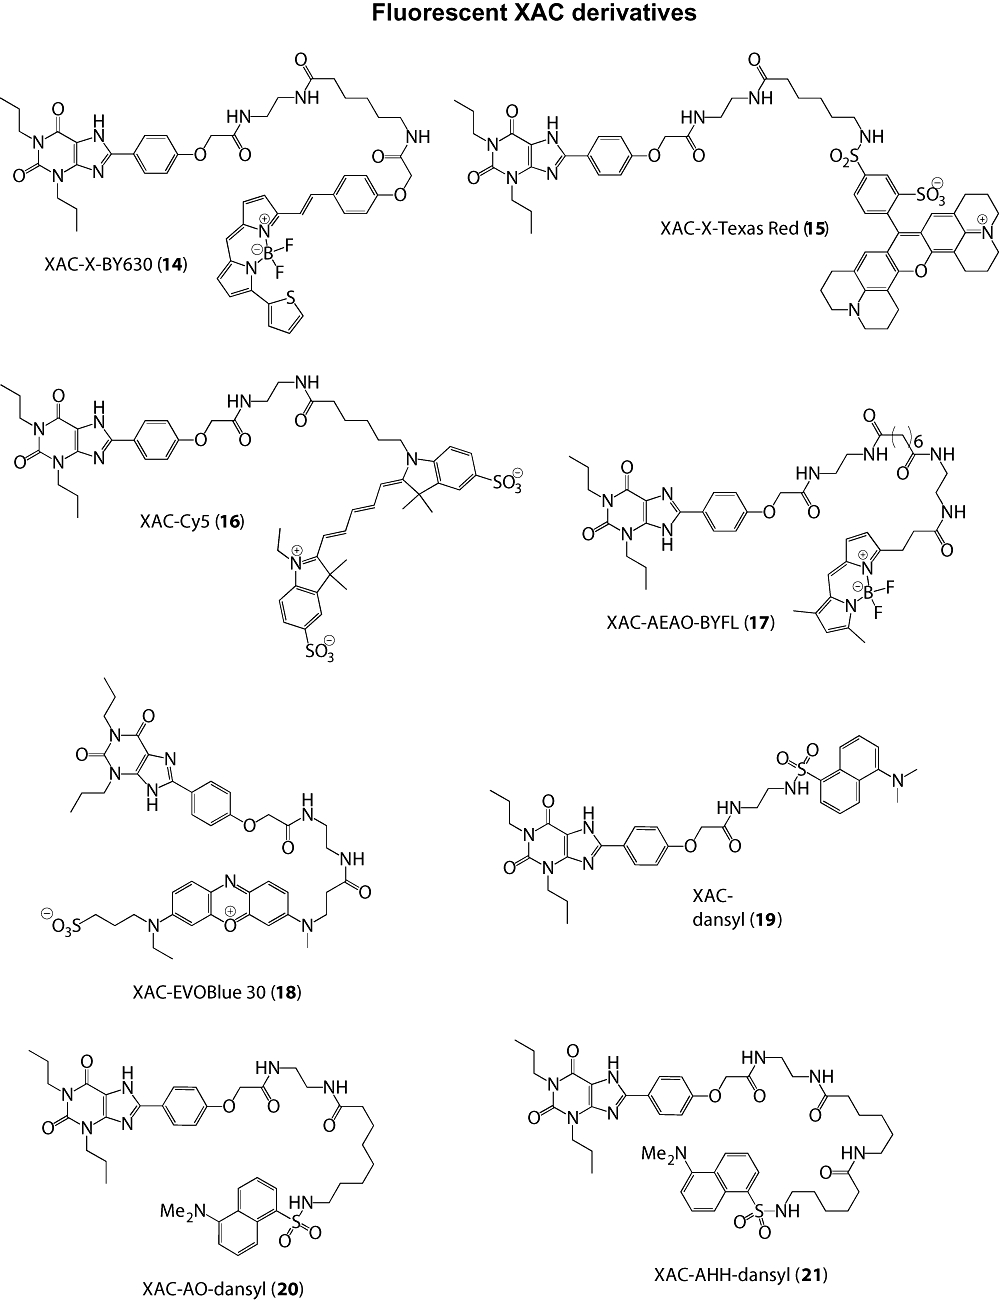
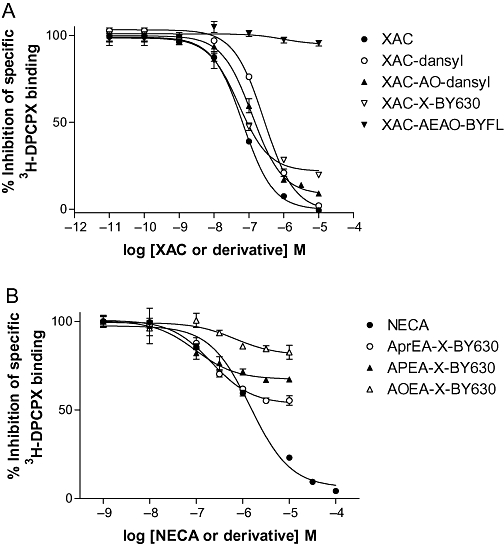
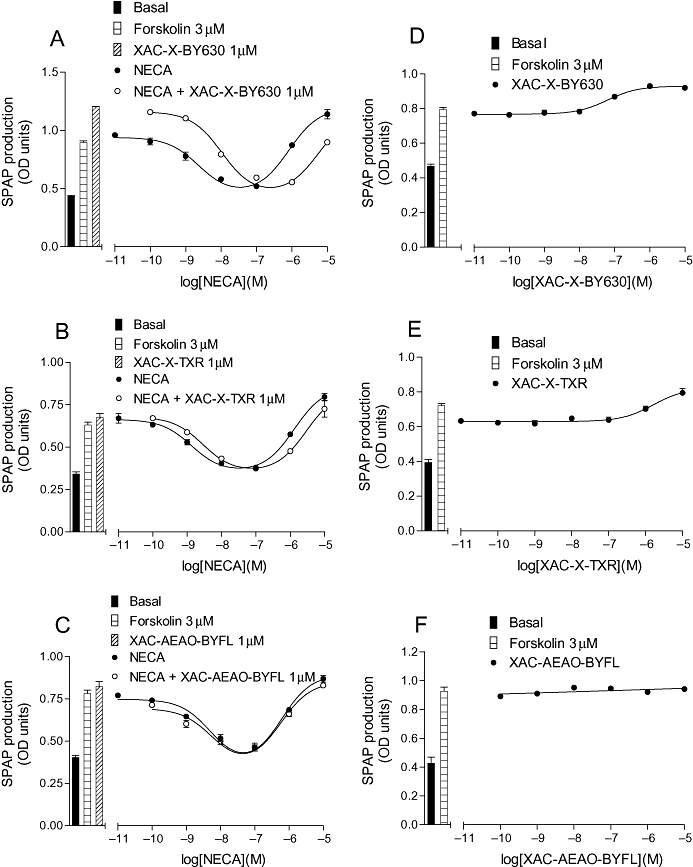
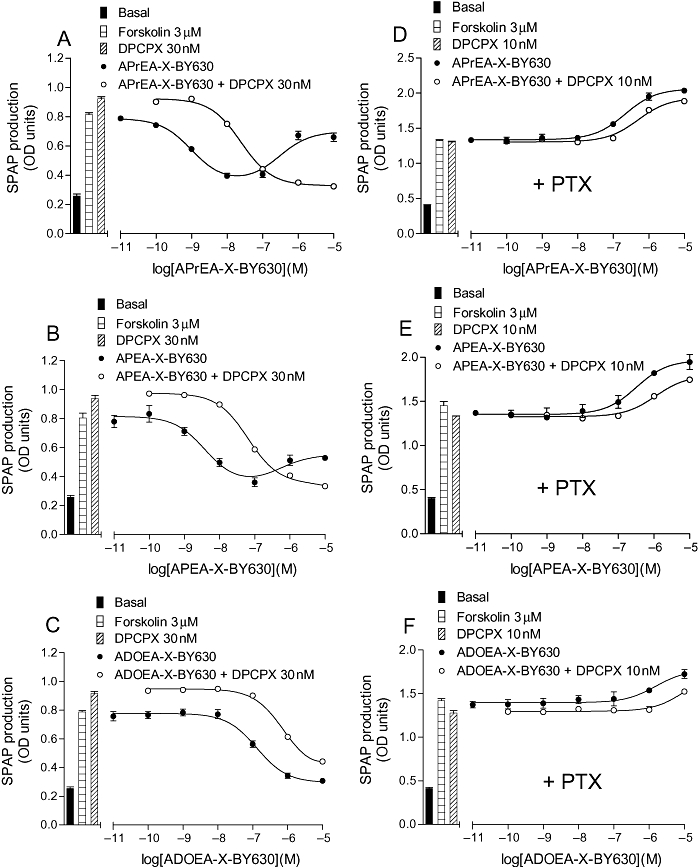
Experimental approach: Chinese hamster ovary cells stably expressing the human adenosine A(1) receptor and a cyclic 3',5' adenosine monophosphate response element-secreted placental alkaline phosphatase (CRE-SPAP) reporter gene, together with whole cell [(3)H]-8-cyclopentyl-1,3-dipropylxanthine (DPCPX) radioligand binding, were used to evaluate the pharmacological properties of a range of fluorescent ligands based on the antagonist xanthine amine congener (XAC) and the agonist 5' (N-ethylcarboxamido) adenosine (NECA).

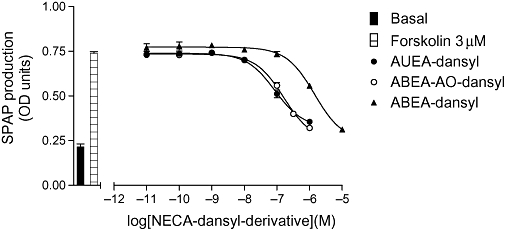
Key results: Derivatives of NECA and XAC with different fluorophores, but equivalent linker length, showed significant differences in their binding properties to the adenosine A(1) receptor. The BODIPY 630/650 derivatives had the highest affinity. Linker length also affected the pharmacological properties, depending on the fluorophore used. Particularly in fluorescent agonists, higher agonist potency could be achieved with large or small linkers for dansyl and BODIPY 630/650 derivatives, respectively.

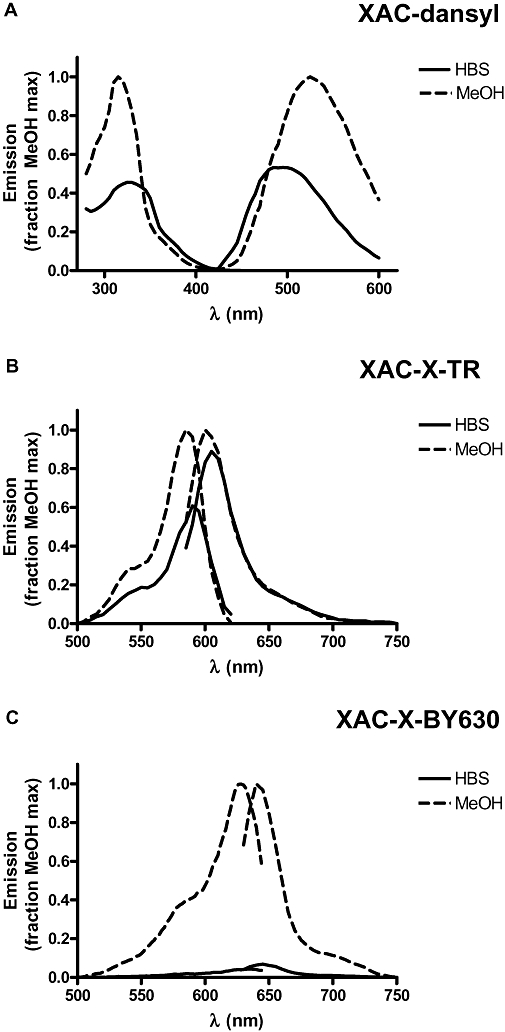
Conclusions and implications: The pharmacology of a fluorescent ligand was critically influenced by both the fluorophore and the associated linker. Furthermore, our data strongly suggest that the physicochemical properties of the fluorophore/linker pairing determine where in the environment of the target receptor the fluorophore is placed, and this, together with the environmental sensitivity of the resulting fluorescence, may finally decide its utility as a fluorescent probe.


Figures

Figure 1
Figure 1
Chemical structures of fluorescent NECA derivatives. ABEA, N6-(4-aminobutyl)-5′-ethylamino-5′-oxo-5′-deoxyadenosine; ADOEA, N6-(8-amino-3,6-dioxaoctyl)-5′-ethylamino-5′-oxo-5′-deoxyadenosine; AO, 8-aminooctanoyl; AOEA, N6-(8-aminooctyl)-5′-ethylamino-5′-oxo-5′-deoxyadenosine; APEA, N6-(5-aminopentyl)- 5′-ethylamino-5′-oxo-5′-deoxyadenosine; APrEA, N6-(3-aminopropyl)-5′-ethylamino-5′-oxo-5′-deoxyadenosine; AUEA, N6-(11-aminoundecyl)-5′-ethylamino-5′-oxo-5′-deoxyadenosine; X, 6-aminohexanoyl.
Figure 2
Figure 2
Chemical structures of fluorescent XAC derivatives. AEAO, 8-(2-aminoethylamino)-8-oxooctanoyl; AHH, 6-(6-aminohexanamido)hexanoyl; AO, 8-aminooctanoyl; X, 6-aminohexanoyl; XAC, xanthine amine congener.
Figure 3
Figure 3
Inhibition of the specific binding of 3H-DPCPX by fluorescent (A) antagonists and (B) agonists in CHO-A1 cells expressing the human adenosine A1 receptor. Non-specific binding was defined with 10 µM XAC. 3H-DPCPX was used at (A) 1.30 nM or (B) 1.11 nM. Values represent mean ± SEM from triplicate determinations in a single experiment. These separate experiments are representative of (A) five and (B) seven separate experiments. AEAO, 8-(2-aminoethylamino)-8-oxooctanoyl; AO, 8-aminooctanoyl; AOEA, N6-(8-aminooctyl)-5′-ethylamino-5′-oxo-5′-deoxyadenosine; APEA, N6-(5-aminopentyl)-5′-ethylamino-5′-oxo-5′-deoxyadenosine; APrEA, N6-(3-aminopropyl)-5′-ethylamino-5′-oxo-5′-deoxyadenosine; X, 6-aminohexanoyl; CHO, Chinese hamster ovary; DPCPX, 8-cyclopentyl-1,3-dipropylxanthine; NECA, 5′ (N-ethylcarboxamido)adenosine; X, 6-aminohexanoyl; XAC, xanthine amine congener.
Figure 4
Figure 4
CRE-SPAP production in CHO-A1 cells in response to (A) NECA in the presence and absence of 1 µM XAC-X-BY630 (14); (B) NECA in the presence and absence of 1 µM XAC-X-Texas Red (XAC-X-TXR; 15); (C) NECA in the presence and absence of 1 µM XAC-AEAO-BYFL (17); (D) XAC-X-BY630 (14); (E) XAC-X-Texas Red (XAC-X-TXR) and (F) XAC-AEAO-BYFL (17). Bars show basal CRE-SPAP production, that in response to 3 µM forskolin, and for A–C, that in response to 1 µM of the XAC-derivative in the presence of 3 µM forskolin. Data points are mean ± SEM from triplicate values from a single experiment. These separate experiments are representative of (A) 9, (B) 6, (C) 10, (D) 9, (E) 6 and (F) 6 separate experiments. AEAO, 8-(2-aminoethylamino)-8-oxooctanoyl; CHO, Chinese hamster ovary; CRE-SPAP, cyclic 3′,5′ adenosine monophosphate response element-secreted placental alkaline phosphatase; NECA, 5′ (N-ethylcarboxamido)adenosine; X, 6-aminohexanoyl; XAC, xanthine amine congener.
Figure 6
Figure 6
CRE-SPAP production in CHO-A1 cells in response to NECA-dansyl derivatives (AUEA-dansyl, ABEA-AO-dansyl and ABEA-dansyl). Bars show basal CRE-SPAP production, that in response to 3 µM forskolin. Data points are mean ± SEM from triplicate values from a single experiment and this is representative of seven separate experiments. ABEA, N6-(4-aminobutyl)-5′-ethylamino-5′-oxo-5′-deoxyadenosine; AUEA, N6-(11-aminoundecyl)-5′-ethylamino-5′-oxo-5′-deoxyadenosine; CHO, Chinese hamster ovary; CRE-SPAP, cyclic AMP response element-secreted placental alkaline phosphatase; NECA, 5′ (N-ethylcarboxamido)adenosine.
Figure 5
Figure 5
CRE-SPAP production in CHO-A1 cells in response to APrEA-X-BY630 (A and D), APEA-X-BY630 (B and E), ADOEA-X-BY630 (C and F) in the presence and absence of 30 nM DPCPX (A, B and C) and 10 nM DPCPX (D, E and F). The cells in D, E and F were incubated with PTX (100 ng·mL−1) for 24 h before experimentation. Bars show basal CRE-SPAP production, that in response to 3 µM forskolin and that in response to either 30 nM or 10 nM DPCPX in the presence of 3 µM forskolin. Data points are mean ± SEM from triplicate values from a single experiment. These separate experiments are representative of (A) 8, (B) 8, (C) 6, (D) 6, (E) 6 and (F) 6 separate experiments. ADOEA, N6-(8-amino-3,6-dioxaoctyl)-5′-ethylamino-5′-oxo-5′-deoxyadenosine; APEA, N6-(5-aminopentyl)-5′-ethylamino-5′-oxo-5′-deoxyadenosine; APrEA, N6-(3-aminopropyl)-5′-ethylamino-5′-oxo-5′-deoxyadenosine; CHO, Chinese hamster ovary; CRE-SPAP, cyclic AMP response element-secreted placental alkaline phosphatase; DPCPX, 8-cyclopentyl-1,3-dipropylxanthine; NECA, 5′ (N-ethylcarboxamido)adenosine; PTX, Pertussis toxin; X, 6-aminohexanoyl.
Figure 9
Figure 9
The effect of Brilliant Black on the fluorescence of XAC-X-BY630 bound to CHO-A1 cells. CHO-A1 cells were incubated with XAC-X-BY630 (10 nM, 37°C) for 2 min, and a single confocal (A) and simultaneous phase image (C) were acquired. Immediately following the addition of the fluorescence quencher, Brilliant Black (50 µM), similar confocal (B) and phase contrast (D) images were taken, with the darkening of the phase image indicating a successful addition of the Brilliant Black. CHO, Chinese hamster ovary; X, 6-aminohexanoyl; XAC, xanthine amine congener.
Figure 8
Figure 8
Normalized excitation and emission spectra obtained in HBS or methanol for (A) XAC-dansyl (50 µM), (B) XAC-X-Texas Red (1 µM) and (C) XAC-X-BY630 (1 µM). Data have been normalized to the maximum excitation or emission obtained with each ligand in methanol. Excitation maxima were: (A) 320, 315 nm; (B) 590, 585 nm and (C) 628, 634 nm in HBS and methanol respectively. Corresponding emission maxima were: (A) 500, 525 nm; (B) 605, 600 nm and (C) 645, 640 nm. The relative maximal emission intensities (HBS; methanol) were: (A) 0.26; (B) 0.89 and (C) 0.07. HBS, N-2-Hydroxyethylpiperazine-N′-2-ethanesulfonic acid-buffered saline; X, 6-aminohexanoyl; XAC, xanthine amine congener.
Figure 7
Figure 7
Confocal images of CHO-A1 cells incubated (5 min) with: (A) APrEA-X-BY630 (10 nM), (B) ADOEA-X-BY630 (10 nM), (C, D) XAC-X-BY630 (30 nM), (E, F) XAC-X-Texas Red (30 nM) and (G) XAC-dansyl (10 nM). In D and F, images were collected immediately after the fluorescent ligand had been removed from the cells. H shows a representative image of autofluorescence collected under identical conditions to image (G), but without the addition of XAC-dansyl. ADOEA, N6-(8-amino-3,6-dioxaoctyl)-5′-ethylamino-5′-oxo-5′-deoxyadenosine; APrEA, N6-(3-aminopropyl)-5′-ethylamino-5′-oxo-5′-deoxyadenosine; CHO, Chinese hamster ovary; X, 6-aminohexanoyl; XAC, xanthine amine congener.

References

    1. Alexander SPH, Mathie A, Peters JA. Guide to Receptors and Channels (GRAC), 3rd edition (2008 revision) Br J Pharmacol. 2008;153(Suppl. 2):S1–S209. - PMC - PubMed
    1. Baker JG, Hill SJ. A comparison of the antagonist affinities for the Gi and Gs-coupled states of the human adenosine A1 receptor. J Pharmacol Exp Ther. 2007;320:218–228. - PubMed
    1. Baker JG, Hall IP, Hill SJ. Pharmacology and direct visualisation of BODIPY-TMR-CGP: a long acting fluorescent β2-adrenoceptor agonist. Br J Pharmacol. 2003;139:232–242. - PMC - PubMed
    1. Briddon SJ, Hill SJ. Pharmacology under the microscope: The use of fluorescence correlation spectroscopy to determine the properties of ligand-receptor complexes. Trends Pharmacol Sci. 2007;28:637–645. - PMC - PubMed
    1. Briddon SJ, Middleton RJ, Cordeaux Y, Flavin FM, Weinstein JA, George MW, et al. Quantitative analysis of the formation and diffusion of A1-adenosine receptor-antagonist complexes in living cells. Proc Natl Acad Sci USA. 2004;101:4673–4678. - PMC - PubMed

Publication types

MeSH terms