. 2010 Feb;31(3):508-20.
doi: 10.1111/j.1460-9568.2010.07085.x. Epub 2010 Jan 25.

Visual restoration and transplant connectivity in degenerate rats implanted with retinal progenitor sheets

Affiliations

Visual restoration and transplant connectivity in degenerate rats implanted with retinal progenitor sheets

M J Seiler et al. Eur J Neurosci. 2010 Feb.

Abstract

The aim of this study was to determine whether retinal progenitor layer transplants form synaptic connections with the host and restore vision. Donor retinal sheets, isolated from embryonic day 19 rat fetuses expressing human placental alkaline phosphatase (hPAP), were transplanted to the subretinal space of 18 S334ter-3 rats with fast retinal degeneration at the age of 0.8-1.3 months. Recipients were killed at the age of 1.6-11.8 months. Frozen sections were analysed by confocal immunohistochemistry for the donor cell label hPAP and synaptic markers. Vibratome slices were stained for hPAP, and processed for electron microscopy. Visual responses were recorded by electrophysiology from the superior colliculus (SC) in 12 rats at the age of 5.3-11.8 months. All recorded transplanted rats had restored or preserved visual responses in the SC corresponding to the transplant location in the retina, with thresholds between -2.8 and -3.4 log cd/m(2). No such responses were found in age-matched S334ter-3 rats without transplants, or in those with sham surgery. Donor cells and processes were identified in the host by light and electron microscopy. Transplant processes penetrated the inner host retina in spite of occasional glial barriers between transplant and host. Labeled neuronal processes were found in the host inner plexiform layer, and formed apparent synapses with unlabeled cells, presumably of host origin. In conclusion, synaptic connections between graft and host cells, together with visual responses from corresponding locations in the brain, support the hypothesis that functional connections develop following transplantation of retinal layers into rodent models of retinal degeneration.


Figures

Figure 1
Figure 1. Examples of SC recordings at different light intensities
normal pigmented rat; S334ter rat without surgery (age 3 months); sham surgery rat #16 (age 5.4 months); retinal transplants rat #3 (age 5.3 months), #17 and # 20 (age 3.0 – 3.1 months). The light stimulus (duration 85 ms) is indicated at the bottom of each panel. The onset of light responses is indicated by arrows. A) At a light intensity −0.4 log cd/m2, faint responses with low amplitudes and long latencies can be recorded in the non-surgery and sham surgery S334ter-3 rat, whereas the transplanted rats (#3 and #20) show a robust response in one area that is only slightly delayed compared to normal. Transplanted rats show a more noisy background activity. B) At the slightly reduced light intensity of −1.0 log cd/m2, no responses can be observed in the non-surgery and sham surgery S334ter-3 rat whereas the response from the transplant rats (#3 and #20) remain robust. C) At a much reduced light intensity of −3.4 log cd/m2, there is no response in the sham surgery rat. In the transplant rats (#3 and #17), there are still clear responses, although with a much longer latency than in the normal rat. [Rat #20 had a response threshold of −2.8 log cd/m2 (not shown) and did not respond at this light intensity.]
Figure 2
Figure 2. Combination of donor cell label (hPAP) with the pre-synaptic markers synapsin, syntaxin (HPC-1), and synaptophysin (confocal imaging)
All images are of rat # 17. Similar images were obtained from rats #18–21. All images are oriented with the host ganglion cell layer up. White asterisks (*) indicate nuclei of remnant host cones (containing clumped chromatin). The cytoplasm, including processes of all transplant cells (not the nuclei) are labeled by hPAP (green). (A1–2) Combination of mouse anti hPAP (8B6, green) in combination with rabbit anti synapsin (red, marker for synaptic vesicles and synaptic terminals), and DAPI nuclear label (blue). Both images are three-dimensional (3D) stacks. (A1) Overview. Transplant processes extend past remnants of host cones to the outer plexiform layer of the host. In addition, there are numerous hPAP stained processes in the inner plexiform layer of the host, mostly obscured by the synapsin stain. Arrowhead points to a group of processes that is visible at this level. The white dashed box indicates enlargement in A2. (A2) Enlargement of transplant-host interface. Examples of areas with potential transplant-host synaptic interactions (transplant processes close to red stained synaptic structures outside transplant) are indicated by arrows. The black space in the transplant-host interface is a cutting artifact. (B1–3) Rabbit anti hPAP (SP15) (green) in combination with mouse anti syntaxin (HPC-1) (red). Syntaxin stains synaptic layers and somas of amacrine cells. (B1) Overview of transplant. Composition of two single slices at the same focus level. Note the overlap of red and green channels in the transplant-host interface. Box with green dashes indicates area shown in B2; box with red dashes indicates area shown in B3. (B2) 3D stack of transplant-host interface, showing hPAP staining (green channel). Transplant processes are extending into the host inner nuclear layer. Numerous fine processes can be seen in the host inner plexiform layer (arrow heads). (B3) higher enlargement of transplant-host interface, 3D stack of red and green channel. Arrow points to colocalization of hPAP and syntaxin in transplant process. (C1–4) Rabbit anti hPAP (SP15) (green) in combination with mouse anti synaptophysin (red, marker for synaptic vesicles) (slide adjacent to Fig. 2B). (C1) Overview of transplant. Projection of stack at several focus levels. Box with green dashes indicates area shown in C2; box with white dashes indicates area shown in C4. Arrow points to area enlarged in C3. (C2) 3D stack of transplant-host interface, hPAP staining (green channel). Arrowheads point to transplant processes close to host ganglion cell layer. Note the transplant process extending into the host inner nuclear layer on the right side. (C3) Enlargement of transplant-host interface in C1, single slice. Arrow points to transplant process in contact with synaptophysin immunoreactive process, presumably from host. (C4) 3D stack of same area at higher magnification, making it clear that the transplant process is indeed contacting a host-derived process (arrow). Bars = 20 µm (A1, A2, B1, C1), 10 µm (B2, B3, C2–C4).
Figure 3
Figure 3. Combination of donor cell label (hPAP) with the synaptic markers mGluR6, bassoon, and PSD95 (confocal imaging)
All images are of rat # 17. Similar images were obtained from rats #18–21. All images are oriented with the host ganglion cell layer up. White asterisks (*) indicate remnants of host cone nuclei with clumped chromatin. Black spaces at the transplant edge towards the host are a cutting artifact. (A1–3) Combination of mouse anti hPAP (8B6, green) with rabbit anti mGluR6 (marker of synaptic terminals of on-bipolar cells; red); 3D stack images (section adjacent to Fig. 2A). (A1) Overview. mGluR6 stains the dendritic tips of host and graft on-bipolar cells in the outer plexiform later. Transplant processes extending past host cones, and penetrating host inner nuclear layer. There are also numerous processes in the host inner plexiform layer close to the inner nuclear layer (arrow heads). White dashed box indicates area of enlargement in A2. (A2) Enlargement, showing interaction between transplant processes and host on-bipolar cell dendritic tips. White dashed box shows area of enlargement in A3. (A3) Transplant process penetrating host inner nuclear layer. Arrow points to process double-stained for hPAP and mGluR6. (B1–3) Rabbit anti hPAP (SP15) (green) in combination with mouse anti Bassoon (marker for ribbon synapses, red) (section adjacent to Fig. 2B). (B1) Overview of same area as in Fig. 2B. DAPI nuclear counterstain. Arrows point to transplant-host interface in host outer plexiform layer. Note row of red dots indicating ribbon synapses in outer plexiform layer of host. Some of the dots are just outside, but close to transplant processes. (B2) Adjacent area on same section (red and green channel only) at a more disorganized transplant area where photoreceptors have rolled up into a rosette. Note numerous transplant processes in the host inner plexiform layer (arrow heads). Box indicates area of enlargement in B3. (B3) Arrow head points to thick process at border of host inner nuclear and inner plexiform layer. (C1–2) Rabbit anti hPAP (SP15) (green) in combination with mouse anti PSD95 (post-synaptic marker; red) (section adjacent to Fig. 2B and Fig. 3B). (C1) Overview, single slice. Arrow heads point to transplant processes in contact with PSD95 immunoreactive processes in host inner plexiform layer. (C2) 3D stack of area in white dashed box in C1. Bars = 20 µm (A1, A2, B1, B2, C1), 10 µm (A3, B3, C2).
Figure 4
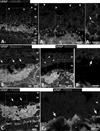
Figure 4. Identification of the transplant by immunohistochemistry for human placental alkaline phosphatase (hPAP) – light microscopy
Dashes indicate approximate transplant-host border, where applicable. A) Vibratome slice, thickness 100 µm (rat #3), stained with monoclonal antibody 8B6 against hPAP (dilution 1:1000). The transplant inner plexiform and outer plexiform layers appear dark brown. B) Control slice (rat #7), incubated with blocking serum instead of primary antibody, shows even light brown stain. C) Example of stained vibratome slice (Rat #5). This transplant has developed an area with photoreceptors in normal orientation and outer segments (indicated by asterisks). The DAB stain penetrated the surface of the 80–100 µm-thick vibratome slices up to a depth of approximately 10 µm. Thus, if the surface of the tissue is unevenly oriented and sectioned, as seen in A) and B), only partial staining is visible at a given sectioning level. C1) DAB stain at transplant-host interface. C2) Stain of transplant photoreceptors was seen in previous sections of this slice. D) Rat #1. DAB stain of transplant photoreceptors and in host inner plexiform layer. The approximate border between transplant and host is indicated by dashes. Infiltration of the inner plexiform layer of the host retina by many labeled graft processes (examples indicated by arrow heads). The stained transplant-host interface had been seen in previous sections because the slice was not embedded perfectly flat. – E)-G) Controls. E) Section through control slice of rat # 7 that had been incubated with blocking serum instead of primary antibody. Non-specific edge staining in the ganglion cell layer and blood vessels is apparent, but no stain exists in the transplant. F) Section through non-surgery fellow eye (degenerate retina without photoreceptor layer) of rat#13 without transplant. No stain. The RPE cells (arrowhead) contain black melanin granules. G) Section of host retina outside transplant area (rat #9). No stain. Bars = 100 µm (A), 50 µm (B, C2), 20 µm (C1, E–G).
Figure 5
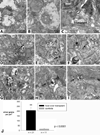
Figure 5. Examples of controls in the electron microscope
Unspecific silver grains can be seen as edge stain in A), and are indicated by arrows in (D–I). This unspecific stain is clearly different from the specific stain shown in Figures 5–8. (A–C) Omission of primary antibody (blocking serum control, rat #11). (D–F) Host retina outside transplant area, stained with hPAP antibody 8B6 (rat # 9). (GD–I) Non-surgery fellow eye, stained with hPAP antibody MAB102 (rat #12). J) Diagram: Silver grains in selected images of the host inner plexiform layer of transplants and controls were counted by 2 independent observers. The results were averaged and expressed as silver grains/µm2. Error bars indicate S.E.M.
Figure 6
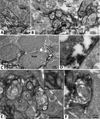
Figure 6. Processes at transplant – host interface (EM)
The hPAP immunolabel can be recognized as darkness at lower magnification (A, C) and is confirmed by silver grains (dark dots) at high magnification (B, D, E–F). Note transplant processes extending into the inner nuclear layer of the host retina (A–D). Boxes in A, and C indicate areas of enlargement in B and D, respectively. E, F) Labeled transplant processes in close contact with unlabeled processes of presumable host cells. Box in E) shows enlarged process in insert. – (A) Low power overview (rat #10). (B) Enlargement. Absence of silver grains in the host tissue. (C, D) Rat #13. (E, F) Rat #11. Bars = 1 µm (A, C), 0.5 µm (E), and 0.2 µm (B, D, F).
Figure 7
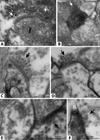
Figure 7. Transplant processes and synapses in inner plexiform layer of the host retina
Immunohistochemistry for hPAP, recognizable as silver grains. Arrows indicate a presynaptic element of an apparent synapse between transplant and host cell. A) Labeled ribbon synapse. Long synaptic ribbon indicated by asterisks. Labeled processes are pre-synaptic in A, D, E, and post-synaptic in B, C, F. (A, E) Rat # 6. (B) Rat #13. (C) Rat #10. (D,F) Rat # 8. Bars = 0.2 µm.

Similar articles

Cited by

References

    1. Arai S, Thomas BB, Seiler MJ, Aramant RB, Qiu G, Mui C, de Juan E, Sadda SR. Restoration of visual responses following transplantation of intact retinal sheets in rd mice. Exp Eye Res. 2004;79:331–341. - PubMed
    1. Aramant RB, Seiler MJ. Retinal Transplantation - Advantages of Intact Fetal Sheets. Prog Retin Eye Res. 2002;21:57–73. - PubMed
    1. Barnstable CJ, Hofstein R, Akagawa K. A marker of early amacrine cell development in rat retina. Brain Res. 1985;352:286–290. - PubMed
    1. Brandstatter JH, Fletcher EL, Garner CC, Gundelfinger ED, Wassle H. Differential expression of the presynaptic cytomatrix protein bassoon among ribbon synapses in the mammalian retina. Eur J Neurosci. 1999;11:3683–3693. - PubMed
    1. Dick O, tom Dieck S, Altrock WD, Ammermuller J, Weiler R, Garner CC, Gundelfinger ED, Brandstatter JH. The presynaptic active zone protein bassoon is essential for photoreceptor ribbon synapse formation in the retina. Neuron. 2003;37:775–786. - PubMed

Publication types

MeSH terms