. 2010 Jan 27:8:9.
doi: 10.1186/1741-7007-8-9.

Reconstructing the ups and downs of primate brain evolution: implications for adaptive hypotheses and Homo floresiensis

Affiliations

Reconstructing the ups and downs of primate brain evolution: implications for adaptive hypotheses and Homo floresiensis

Stephen H Montgomery et al. BMC Biol. .

Abstract

Background: Brain size is a key adaptive trait. It is often assumed that increasing brain size was a general evolutionary trend in primates, yet recent fossil discoveries have documented brain size decreases in some lineages, raising the question of how general a trend there was for brains to increase in mass over evolutionary time. We present the first systematic phylogenetic analysis designed to answer this question.

Results: We performed ancestral state reconstructions of three traits (absolute brain mass, absolute body mass, relative brain mass) using 37 extant and 23 extinct primate species and three approaches to ancestral state reconstruction: parsimony, maximum likelihood and Bayesian Markov-chain Monte Carlo. Both absolute and relative brain mass generally increased over evolutionary time, but body mass did not. Nevertheless both absolute and relative brain mass decreased along several branches. Applying these results to the contentious case of Homo floresiensis, we find a number of scenarios under which the proposed evolution of Homo floresiensis' small brain appears to be consistent with patterns observed along other lineages, dependent on body mass and phylogenetic position.

Conclusions: Our results confirm that brain expansion began early in primate evolution and show that increases occurred in all major clades. Only in terms of an increase in absolute mass does the human lineage appear particularly striking, with both the rate of proportional change in mass and relative brain size having episodes of greater expansion elsewhere on the primate phylogeny. However, decreases in brain mass also occurred along branches in all major clades, and we conclude that, while selection has acted to enlarge primate brains, in some lineages this trend has been reversed. Further analyses of the phylogenetic position of Homo floresiensis and better body mass estimates are required to confirm the plausibility of the evolution of its small brain mass. We find that for our dataset the Bayesian analysis for ancestral state reconstruction is least affected by inclusion of fossil data suggesting that this approach might be preferable for future studies on other taxa with a poor fossil record.


Figures

Figure 1
Figure 1
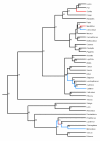
Phylogeny of primates with extinct primates. a) Phylogeny used for main reconstruction analysis. Extinct primates are denoted with an asterisk (*); b) and c) Phylogenies off Homini used for the H. floresiensis analysis based on the two most parsimonious topologies from Argue et al. [43], the rest of the phylogeny was left as shown in a). b) corresponds to Argue et al.'s Tree 1 and c) to Tree 2. Branches are drawn proportional to time. This figure was prepared in Mesquite [110].
Figure 2
Figure 2
Phylogeny of extant primate genera. Branches are drawn proportional to time. This figure was prepared in Mesquite [110].
Figure 3
Figure 3
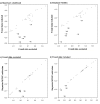
Correlations between estimates of absolute brain mass in log(grams). a) Correlations are shown with and without fossil data using ML; b) with and without fossil data using Bayesian MCMC; c) without fossil data between ML and Bayesian MCMC results; d) with fossil data between ML and bayesian MCMC results. Numbers indicate nodes in figure 2.
Figure 4
Figure 4
Correlations between estimates of relative brain mass. a) Correlations are shown with and without fossil data using ML; b) with and without fossil data using Bayesian MCMC; c) without fossil data between ML and Bayesian MCMC results; d) with fossil data between ML and bayesian MCMC results. Numbers indicate nodes in Figure 2.
Figure 5
Figure 5
Posterior distributions of log-likelihoods for the non-directional and directional models. Figure a) shows body mass; b) brain mass; c) relative brain size. The log-likelihood of the directional model is shown in red, the non-directional model in blue. The posterior distributions of ancestral state estimates were obtained using uniform priors, two million iterations and a sampling interval of 100 (see Methods). The harmonic means and Bayes Factors of the posterior distributions are given in Table 1.
Figure 6
Figure 6
Posterior distributions of trait estimates for the LCA of living primates for a) body mass and b) brain mass. Histograms are plotted from a posterior distribution of ancestral state estimates obtained using uniform priors (prior range: -100 to +100) acceptance rates were within 20 to 40% (see methods). To ensure the chain fully explored the parameter space, we extended the MCMC run to 25 million iterations with a sampling interval of 1500.
Figure 7
Figure 7
Evolutionary trajectories of brain and body mass. Evolution of brain (red) and body (blue) mass from the ancestral primate to a) Homo (solid line) and Pan (dashed line) and b) Ateles (solid line) and Daubentonia (dashed line) showing parallel increase in brain and body mass; c) Callithrix, and d) Microcebus demonstrating secondary reduction in both brain and body mass: note the reduction in brain mass is lower than the reduction in body mass leading to an increase in relative brain size (see Additional file 1, Table S4).

Similar articles

Cited by

References

    1. Harvey PH, Pagel MD. The Comparative Method in Evolutionary Biology. Oxford University Press, Oxford; 1991.
    1. Cunningham CW, Omland KE, Oakley TH. Reconstructing ancestral character states: a critical reappraisal. Trends Ecol Evol. 1998;13:361–366. doi: 10.1016/S0169-5347(98)01382-2. - DOI - PubMed
    1. Pagel M. Inferring the historical patterns of biological evolution. Nature. 1999;401:877–884. doi: 10.1038/44766. - DOI - PubMed
    1. Roth G, Dicke U. Evolution of the brain and intelligence. Trends Cogn Sci. 2005;9:250–257. doi: 10.1016/j.tics.2005.03.005. - DOI - PubMed
    1. Barton RA. Primate brain evolution: integrating comparative, neurophysiological and ethological data. Evolutionary Anthropology. 2006;15:224–236. doi: 10.1002/evan.20105. - DOI

Publication types

LinkOut - more resources