Association of adipocyte genes with ASP expression: a microarray analysis of subcutaneous and omental adipose tissue in morbidly obese subjects
- PMID: 20105310
- PMCID: PMC2843642
- DOI: 10.1186/1755-8794-3-3
Association of adipocyte genes with ASP expression: a microarray analysis of subcutaneous and omental adipose tissue in morbidly obese subjects
Abstract
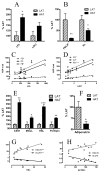
Background: Prevalence of obesity is increasing to pandemic proportions. However, obese subjects differ in insulin resistance, adipokine production and co-morbidities. Based on fasting plasma analysis, obese subjects were grouped as Low Acylation Stimulating protein (ASP) and Triglyceride (TG) (LAT) vs High ASP and TG (HAT). Subcutaneous (SC) and omental (OM) adipose tissues (n = 21) were analysed by microarray, and biologic pathways in lipid metabolism and inflammation were specifically examined.
Methods: LAT and HAT groups were matched in age, obesity, insulin, and glucose, and had similar expression of insulin-related genes (InsR, IRS-1). ASP related genes tended to be increased in the HAT group and were correlated (factor B, adipsin, complement C3, p < 0.01 each). Differences between LAT and HAT group were almost exclusively in SC tissue, with little difference in OM tissue. Increased C5L2 (p < 0.01), an ASP receptor, in HAT suggests a compensatory ASP pathway, associated with increased TG storage.
Results: HAT adipose tissue demonstrated increased lipid related genes for storage (CD36, DGAT1, DGAT2, SCD1, FASN, and LPL), lipolysis (HSL, CES1, perilipin), fatty acid binding proteins (FABP1, FABP3) and adipocyte differentiation markers (CEBPalpha, CEBPbeta, PPARgamma). By contrast, oxidation related genes were decreased (AMPK, UCP1, CPT1, FABP7). HAT subjects had increased anti-inflammatory genes TGFB1, TIMP1, TIMP3, and TIMP4 while proinflammatory PIG7 and MMP2 were also significantly increased; all genes, p < 0.025.
Conclusion: Taken together, the profile of C5L2 receptor, ASP gene expression and metabolic factors in adipose tissue from morbidly obese HAT subjects suggests a compensatory response associated with the increased plasma ASP and TG.
Figures


Similar articles
-
Adipose tissue gene expression of factors related to lipid processing in obesity.PLoS One. 2011;6(9):e24783. doi: 10.1371/journal.pone.0024783. Epub 2011 Sep 22. PLoS One. 2011. PMID: 21966368 Free PMC article.
-
Influence of obesity and insulin sensitivity on insulin signaling genes in human omental and subcutaneous adipose tissue.J Lipid Res. 2008 Feb;49(2):308-23. doi: 10.1194/jlr.M700199-JLR200. Epub 2007 Nov 6. J Lipid Res. 2008. PMID: 17986714
-
Association of immune and metabolic receptors C5aR and C5L2 with adiposity in women.Mediators Inflamm. 2014;2014:413921. doi: 10.1155/2014/413921. Epub 2014 Jan 12. Mediators Inflamm. 2014. PMID: 24523571 Free PMC article.
-
Reduced adipose tissue triglyceride synthesis and increased muscle fatty acid oxidation in C5L2 knockout mice.J Endocrinol. 2007 Aug;194(2):293-304. doi: 10.1677/JOE-07-0205. J Endocrinol. 2007. PMID: 17641279
-
Acylation stimulating protein/C3adesArg in the metabolic states: role of adipocyte dysfunction in obesity complications.J Physiol. 2024 Mar;602(5):773-790. doi: 10.1113/JP285127. Epub 2024 Feb 2. J Physiol. 2024. PMID: 38305477 Review.
Cited by
-
Central obesity, type 2 diabetes and insulin: exploring a pathway full of thorns.Arch Med Sci. 2015 Jun 19;11(3):463-82. doi: 10.5114/aoms.2015.52350. Arch Med Sci. 2015. PMID: 26170839 Free PMC article.
-
A survey of the genetics of stomach, liver, and adipose gene expression from a morbidly obese cohort.Genome Res. 2011 Jul;21(7):1008-16. doi: 10.1101/gr.112821.110. Epub 2011 May 20. Genome Res. 2011. PMID: 21602305 Free PMC article.
-
DNA methylation map in circulating leukocytes mirrors subcutaneous adipose tissue methylation pattern: a genome-wide analysis from non-obese and obese patients.Sci Rep. 2017 Feb 17;7:41903. doi: 10.1038/srep41903. Sci Rep. 2017. PMID: 28211912 Free PMC article.
-
Maternal obesity during pregnancy leads to adipose tissue ER stress in mice via miR-126-mediated reduction in Lunapark.Diabetologia. 2021 Apr;64(4):890-902. doi: 10.1007/s00125-020-05357-4. Epub 2021 Jan 27. Diabetologia. 2021. PMID: 33501603 Free PMC article.
-
AMP-activated protein kinase: an emerging drug target to regulate imbalances in lipid and carbohydrate metabolism to treat cardio-metabolic diseases.J Lipid Res. 2012 Dec;53(12):2490-514. doi: 10.1194/jlr.R025882. Epub 2012 Jul 13. J Lipid Res. 2012. PMID: 22798688 Free PMC article. Review.
References
Publication types
MeSH terms
Substances
Grants and funding
LinkOut - more resources
Full Text Sources
Medical
Molecular Biology Databases
Research Materials
Miscellaneous

