Metabolic regulation of Escherichia coli and its gdhA, glnL, gltB, D mutants under different carbon and nitrogen limitations in the continuous culture
- PMID: 20105320
- PMCID: PMC2827463
- DOI: 10.1186/1475-2859-9-8
Metabolic regulation of Escherichia coli and its gdhA, glnL, gltB, D mutants under different carbon and nitrogen limitations in the continuous culture
Abstract
Background: It is quite important to understand how the central metabolism is regulated under nitrogen (N)- limitation as well as carbon (C)- limitation. In particular, the effect of C/N ratio on the metabolism is of practical interest for the heterologous protein production, PHB production, etc. Although the carbon and nitrogen metabolisms are interconnected and the overall mechanism is complicated, it is strongly desirable to clarify the effects of culture environment on the metabolism from the practical application point of view.
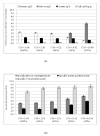
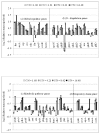
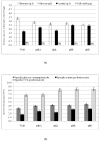
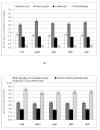
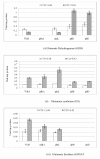
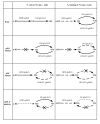
Results: The effect of C/N ratio on the metabolism in Escherichia coli was investigated in the aerobic continuous culture at the dilution rate of 0.2 h-1 based on fermentation data, transcriptional RNA level, and enzyme activity data. The glucose concentration was kept at 10 g/l, while ammonium sulfate concentration was varied from 5.94 to 0.594 g/l. The resultant C/N ratios were 1.68 (100%), 2.81(60%), 4.21(40%), 8.42(20%), and 16.84(10%), where the percentage values in brackets indicate the ratio of N- concentration as compared to the case of 5.94 g/l of ammonium sulfate. The mRNA levels of crp and mlc decreased, which caused ptsG transcript expression to be up-regulated as C/N ratio increased. As C/N ratio increased cra transcript expression decreased, which caused ptsH, pfkA, and pykF to be up-regulated. At high C/N ratio, transcriptional mRNA level of soxR/S increased, which may be due to the activated respiratory chain as indicated by up-regulations of such genes as cyoA, cydB, ndh as well as the increase in the specific CO2 production rate. The rpoN transcript expression increased with the increase in C/N ratio, which led glnA, L, G and gltD transcript expression to change in similar fashion. The nac transcript expression showed similar trend as rpoN, while gdhA transcript expression changed in reverse direction. The transcriptional mRNA level of glnB, which codes for PII, glnD and glnK increased as C/N ratio increases. It was shown that GS-GOGAT pathway was activated for gdhA mutant under N- rich condition. In the case of glnL mutant, GOGAT enzyme activity was reduced as compared to the wild type under N- limitation. In the case of gltB, D mutants, GDH and GS enzymes were utilized under both N- rich and N- limited conditions. In this case, the transcriptional mRNA level of gdhA and corresponding GDH enzyme activity was higher under N- limitation as compared to N- rich condition.
Conclusion: The metabolic regulation of E.coli was clarified under both carbon (C)- limitation and nitrogen (N)- limitation based on fermentation, transcriptional mRNA level and enzyme activities. The overall regulation mechanism was proposed. The effects of knocking out N- assimilation pathway genes were also clarified.
Figures



Similar articles
-
Metabolic regulation of Escherichia coli and its phoB and phoR genes knockout mutants under phosphate and nitrogen limitations as well as at acidic condition.Microb Cell Fact. 2011 May 20;10:39. doi: 10.1186/1475-2859-10-39. Microb Cell Fact. 2011. PMID: 21599905 Free PMC article.
-
Transcriptional regulation of main metabolic pathways of cyoA, cydB, fnr, and fur gene knockout Escherichia coli in C-limited and N-limited aerobic continuous cultures.Microb Cell Fact. 2011 Jan 27;10:3. doi: 10.1186/1475-2859-10-3. Microb Cell Fact. 2011. PMID: 21272324 Free PMC article.
-
Catabolic regulation analysis of Escherichia coli and its crp, mlc, mgsA, pgi and ptsG mutants.Microb Cell Fact. 2011 Aug 11;10:67. doi: 10.1186/1475-2859-10-67. Microb Cell Fact. 2011. PMID: 21831320 Free PMC article.
-
Nitrogen assimilation in Escherichia coli: putting molecular data into a systems perspective.Microbiol Mol Biol Rev. 2013 Dec;77(4):628-95. doi: 10.1128/MMBR.00025-13. Microbiol Mol Biol Rev. 2013. PMID: 24296575 Free PMC article. Review.
-
On multiple-nutrient-limited growth of microorganisms, with special reference to dual limitation by carbon and nitrogen substrates.Antonie Van Leeuwenhoek. 1991 Oct-Nov;60(3-4):225-34. doi: 10.1007/BF00430367. Antonie Van Leeuwenhoek. 1991. PMID: 1687236 Review.
Cited by
-
Metabolic Regulation of a Bacterial Cell System with Emphasis on Escherichia coli Metabolism.ISRN Biochem. 2013 Feb 18;2013:645983. doi: 10.1155/2013/645983. eCollection 2013. ISRN Biochem. 2013. PMID: 25937963 Free PMC article. Review.
-
Optimization of carbon source and glucose feeding strategy for improvement of L-isoleucine production by Escherichia coli.Biotechnol Biotechnol Equip. 2015 Mar 4;29(2):374-380. doi: 10.1080/13102818.2015.1006899. Epub 2015 Feb 4. Biotechnol Biotechnol Equip. 2015. PMID: 26019655 Free PMC article.
-
Metabolic regulation of Escherichia coli and its phoB and phoR genes knockout mutants under phosphate and nitrogen limitations as well as at acidic condition.Microb Cell Fact. 2011 May 20;10:39. doi: 10.1186/1475-2859-10-39. Microb Cell Fact. 2011. PMID: 21599905 Free PMC article.
-
Development of a cost-effective medium for Photorhabdus temperata bioinsecticide production from wastewater and exploration of performance kinetic.Sci Rep. 2021 Jan 12;11(1):779. doi: 10.1038/s41598-020-80773-5. Sci Rep. 2021. PMID: 33436984 Free PMC article.
-
Gene modification of the acetate biosynthesis pathway in Escherichia coli and implementation of the cell recycling technology to increase L-tryptophan production.PLoS One. 2017 Jun 16;12(6):e0179240. doi: 10.1371/journal.pone.0179240. eCollection 2017. PLoS One. 2017. PMID: 28622378 Free PMC article.
References
Publication types
MeSH terms
Substances
LinkOut - more resources
Full Text Sources
Other Literature Sources
Molecular Biology Databases
Research Materials
Miscellaneous

