. 2010 Jan 27:10:13.
doi: 10.1186/1471-230X-10-13.

The role of MR imaging in detection of hepatic iron overload in patients with cirrhosis of different origins

Affiliations

The role of MR imaging in detection of hepatic iron overload in patients with cirrhosis of different origins

Edyta Szurowska et al. BMC Gastroenterol. .

Abstract

Background: There are many pathological conditions with hepatic iron overload. Classical definite diagnostic methods of these disorders are invasive and based on a direct tissue biopsy material. For the last years the role of MR imaging in liver diagnostics has been increasing. MRI shows changes of liver intensity in patients with hepatic iron overload. Changes in MR signal are an indirect consequence of change of relaxation times T2 and T2*, that can be directly measured. The purpose of the study was to evaluate usefulness of MR imaging in the detection of hepatic iron overload in patients with cirrhosis of different origins.

Methods: MR imaging at 1.5T was prospectively performed in 44 patients with liver cirrhosis who had undergone liver biopsy with histopathological assessment of hepatic iron deposits. In all patients the following sequences were used: SE, Express, GRE in T2 and T1-weighted images. Signal intensity (SI) was measured on images obtained with each T2 weighted sequence by means of regions of interest, placed in the liver and paraspinal muscles. The correlation between iron overload, histopathological score, serum ferritin and SI ratio was analyzed.

Results: In 20 patients with iron overload confirmed by the biopsy, the liver parenchyma demonstrated lower signal intensity than that of paraspinal muscles. This effect was visible only in 8 patients with hepatic iron overload in Express T2-weighted images. Higher signal intensity of liver than that of skeletal muscles on GRE - T2 weighted images was noted in 24 patients with cirrhosis and without elevated hepatic iron concentration. We observed a correlation between low and high iron concentration and liver to muscle SI ratio.

Conclusion: MR imaging is a useful and fast noninvasive diagnostic tool for the detection of liver iron overload in patients with cirrhosis of different origins.Liver to muscle SI ratio in GRE-T2-weighted sequence facilitates to differentiate patients with low and high degree of hepatic iron overload, which correlates with the origin of liver cirrhosis.


Figures

Figure 1
Figure 1
47-year-old man with normal hepatic iron level confirmed by the biopsy. Axial MR T2-weighted images performed on gradient echo sequence show normal liver. The signal intensity of liver (fig.1a - the signal intensity of liver is 292) is higher than that of paraspinal muscles (fig.1b - the signal intensity of paraspinal muscles is 181).
Figure 2
Figure 2
68-year-old man with cirrhosis and hemosiderosis confirmed by the biopsy. Axial MR T2-weighted images performed on gradient echo (fig.2a) and Express (fig.2b) sequences show typical findings for hepatic iron overload. The signal intensity of liver (accordingly 23 and 56) is lower than that of paraspinal muscles (accordingly 436 and 269).
Figure 3
Figure 3
45-year-old man with cirrhosis and hemochromatosis confirmed by the biopsy and genetic examination. Axial MR T2-weighted images performed on gradient echo (fig.3a) and Express (fig.3b) sequence show typical findings for hepatic iron overload. The signal intensity of liver (accordingly 33 and 158) is higher than that of paraspinal muscles (accordingly 394 and 307).
Figure 4
Figure 4
Box-and-whisker plots show mean liver signal intensity in patients without (0 pts in Scheuer's grading scale) and with (1-4 pts in Scheuer's grading scale) hepatic iron overload using gradient echo MR sequence.
Figure 5
Figure 5
Box-and-whisker plots show mean liver to muscle signal intensity ratio in patients without (0 pts in Scheuer's grading scale) and with (1-4 pts in Scheuer's grading scale) hepatic iron overload using gradient echo MR sequence.
Figure 6
Figure 6
Relationship between liver signal intensity in Express sequence in T2 weighted images (SI-T2) and iron content in liver by semiquantitative histological Scheuer's grading scale (Fe).
Figure 7
Figure 7
Relationship between liver signal intensity in gradient echo sequence in T2 weighted images (SI-GRE) and iron content in liver by semiquantitative histological Scheuer's grading scale (Fe).
Figure 8
Figure 8
Relationship between the liver-to-muscle SI ratio in Express sequence in T2 weighted images (L/M ratio T2) and iron content in liver by semiquantitative histological Scheuer's grading scale (Fe).
Figure 9
Figure 9
Relationship between the liver-to-muscle SI ratio in gradient echo sequence in T2 weighted images (L/M ratio GRE) and iron content in liver by semiquantitative histological Scheuer's grading scale (Fe).
Figure 10
Figure 10
Box-and-whisker plots show mean liver to muscle signal intensity ratio in two groups of patients - with low to medium (1-2 pts in Scheuer's grading scale) and high (3-4 pts in Scheuer's grading scale) hepatic iron overload using gradient echo MR sequence.
Figure 11
Figure 11
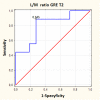
Graphs showing receiver-operating characteristics (ROC) curve analysis to determine a threshold of liver to muscle SI ratio suitable for differentiating patients with low to medium (1-2 pts in Scheuer's grading scale) and high (3-4 pts in Scheuer's grading scale) hepatic iron overload using gradient echo MR sequence. The area under the curve corresponds to accuracy of this method. The sensitivity of this method for the threshold of liver to muscle SI ratio - 0.645 is 89%.
Figure 12
Figure 12
Box-and-whisker plots show mean liver SI in gradient echo sequence in T2 weighted images of patients with cirrhosis of different origins (0-HH, 1- HBV related cirrhosis, 2- HCV-HBV related cirrhosis and 3- HCV related cirrhosis).
Figure 13
Figure 13
Box-and-whisker plots show mean liver-to-muscle ratio in gradient echo sequence in T2 weighted images of patients with cirrhosis of different origins (0-HH, 1- HBV related cirrhosis, 2- HCV-HBV related cirrhosis and 3- HCV related cirrhosis).
Figure 14
Figure 14
Correlation between serum ferritin and Scheuer's grading scale. Point for ferritin level of 11000 μg/L and grade 4 outplaced in figure.
Figure 15
Figure 15
Relationship between SI and iron concentration in phantoms in different sequences.

Similar articles

Cited by

References

    1. Edwards CQ, Griffen LM, Goldgar D, Drummond C, Skolnick MH, Kushner JP. Prevalence of hemochromatosis among 11,065 presumably healthy blood donors. N Engl J Med. 1988;318:1355–1362. - PubMed
    1. Phatak PD, Sharm RL, Raubertas RF, Dunnigan K, O'Leary MT, Braggins C, Cappuccio JD. Prevalence of hereditary hemochromatosis in 16031 primary care patients. Ann Intern Med. 1998;129:954–961. - PubMed
    1. Kuntz E. Hepatology principles and practice. 2. Springer Verlag; 2006. p. 618.
    1. Feder JN, Gnirke A, Thomas W, Tsuchihashi Z, Ruddy DA. et al.A novel MHC class 1-like gene is mutated in patients with hereditary hemochromatosis. Nat Genet. 1996;13:399–409. doi: 10.1038/ng0896-399. - DOI - PubMed
    1. Burt A, Portmann B, Ferrell L, Eds. MacSween's pathology of the liver. Genetic and metabolic liver disease. Disorders of iron metabolism. London Churchill Livingstone Elsevier; 2007. pp. 256–284.

Publication types

MeSH terms