

Muscle performance during frog jumping: influence of elasticity on muscle operating lengths
- PMID: 20106852
- PMCID: PMC2871832
- DOI: 10.1098/rspb.2009.2051
Muscle performance during frog jumping: influence of elasticity on muscle operating lengths
Abstract
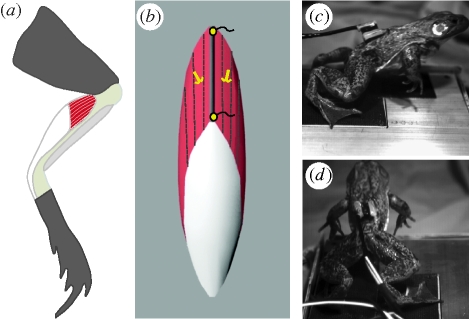
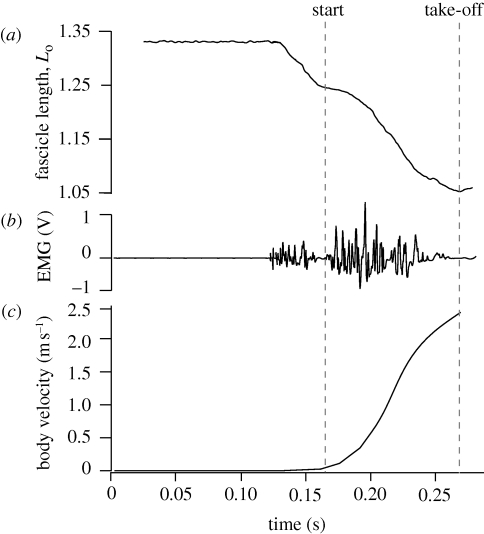
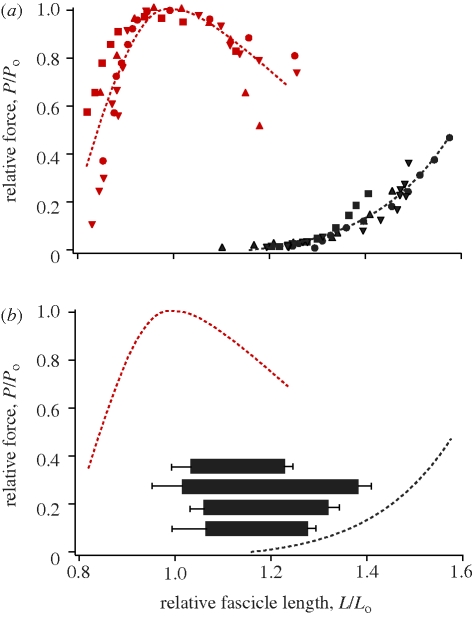
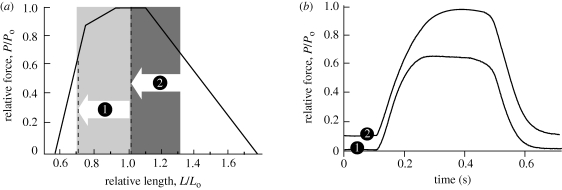
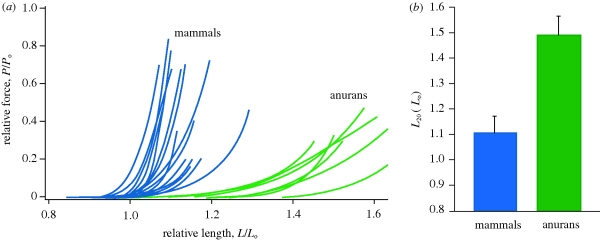
A fundamental feature of vertebrate muscle is that maximal force can be generated only over a limited range of lengths. It has been proposed that locomotor muscles operate over this range of lengths in order to maximize force production during movement. However, locomotor behaviours like jumping may require muscles to shorten substantially in order to generate the mechanical work necessary to propel the body. Thus, the muscles that power jumping may need to shorten to lengths where force production is submaximal. Here we use direct measurements of muscle length in vivo and muscle force-length relationships in vitro to determine the operating lengths of the plantaris muscle in bullfrogs (Rana catesbeiana) during jumping. We find that the plantaris muscle operates primarily on the descending limb of the force-length curve, resting at long initial lengths (1.3 +/- 0.06 L(o)) before shortening to muscle's optimal length (1.03 +/- 0.05 L(o)). We also compare passive force-length curves from frogs with literature values for mammalian muscle, and demonstrate that frog muscles must be stretched to much longer lengths before generating passive force. The relatively compliant passive properties of frog muscles may be a critical feature of the system, because it allows muscles to operate at long lengths and improves muscles' capacity for force production during a jump.
Figures
Similar articles
-
Probing the limits to muscle-powered accelerations: lessons from jumping bullfrogs.J Exp Biol. 2003 Aug;206(Pt 15):2567-80. doi: 10.1242/jeb.00452. J Exp Biol. 2003. PMID: 12819264
-
Activation patterns and length changes in hindlimb muscles of the bullfrog Rana catesbeiana during jumping.J Exp Biol. 1998 Oct;201(Pt 19):2763-77. doi: 10.1242/jeb.201.19.2763. J Exp Biol. 1998. PMID: 9732331
-
Determining the influence of muscle operating length on muscle performance during frog swimming using a bio-robotic model.Bioinspir Biomim. 2012 Sep;7(3):036018. doi: 10.1088/1748-3182/7/3/036018. Epub 2012 Jun 8. Bioinspir Biomim. 2012. PMID: 22677569
-
Some advances in integrative muscle physiology.Comp Biochem Physiol B Biochem Mol Biol. 1998 May;120(1):51-72. doi: 10.1016/s0305-0491(98)00023-6. Comp Biochem Physiol B Biochem Mol Biol. 1998. PMID: 9787778 Review.
-
Force enhancement following an active stretch in skeletal muscle.J Electromyogr Kinesiol. 2002 Dec;12(6):471-7. doi: 10.1016/s1050-6411(02)00041-x. J Electromyogr Kinesiol. 2002. PMID: 12435544 Review.
Cited by
-
A biomechanical paradox in fish: swimming and suction feeding produce orthogonal strain gradients in the axial musculature.Sci Rep. 2021 May 14;11(1):10334. doi: 10.1038/s41598-021-88828-x. Sci Rep. 2021. PMID: 33990621 Free PMC article.
-
The effect of activation level on muscle function during locomotion: are optimal lengths and velocities always used?Proc Biol Sci. 2016 Jan 27;283(1823):20152832. doi: 10.1098/rspb.2015.2832. Epub 2016 Jan 27. Proc Biol Sci. 2016. PMID: 26817770 Free PMC article.
-
Hindlimb muscle spindles inform preparatory forelimb coordination prior to landing in toads.J Exp Biol. 2023 Jan 15;226(2):jeb244629. doi: 10.1242/jeb.244629. Epub 2023 Jan 19. J Exp Biol. 2023. PMID: 36576050 Free PMC article.
-
The Interaction of Compliance and Activation on the Force-Length Operating Range and Force Generating Capacity of Skeletal Muscle: A Computational Study using a Guinea Fowl Musculoskeletal Model.Integr Org Biol. 2019;1(1):obz022. doi: 10.1093/iob/obz022. Epub 2019 Sep 3. Integr Org Biol. 2019. PMID: 32510037 Free PMC article.
-
Functional capacity of kangaroo rat hindlimbs: adaptations for locomotor performance.J R Soc Interface. 2018 Jul;15(144):20180303. doi: 10.1098/rsif.2018.0303. J R Soc Interface. 2018. PMID: 29997260 Free PMC article.
References
-
- Ahn A. N., Monti R. J., Biewener A. A.2003In vivo and in vitro heterogeneity of segment length changes in the semimembranosus muscle of the toad. J. Physiol-London 549, 877–888 (doi:10.1113/jphysiol.2002.038018) - DOI - PMC - PubMed
-
- Altringham J. D., Bottinelli R.1985The descending limb of the sarcomere length-force relation in single muscle fibers of the frog. J. Muscle Res. Cell Motil. 6, 585–600 (doi:10.1007/BF00711916) - DOI - PubMed
-
- Askew G., Marsh R.1998Optimal shortening velocity (V/Vmax) of skeletal muscle during cyclical contractions: length–force effects and velocity-dependent activation and deactivation. J. Exp. Biol. 201, 1527–1540 - PubMed
-
- Brown I. E., Liinamaa T. L., Loeb G. E.1996Relationships between range of motion, Lo, and passive force in five strap-like muscles of the feline hind limb. J. Morphol. 230, 69–77 (doi:10.1002/(SICI)1097-4687(199610)230:1<69::AID-JMOR6>3.0.CO;2-I) - DOI - PubMed
Publication types
MeSH terms
Grants and funding
LinkOut - more resources
Full Text Sources
