. 2010 Jun;27(6):1338-47.
doi: 10.1093/molbev/msq024. Epub 2010 Jan 27.

Escherichia coli rpoB mutants have increased evolvability in proportion to their fitness defects

Affiliations

Escherichia coli rpoB mutants have increased evolvability in proportion to their fitness defects

Jeffrey E Barrick et al. Mol Biol Evol. 2010 Jun.

Abstract

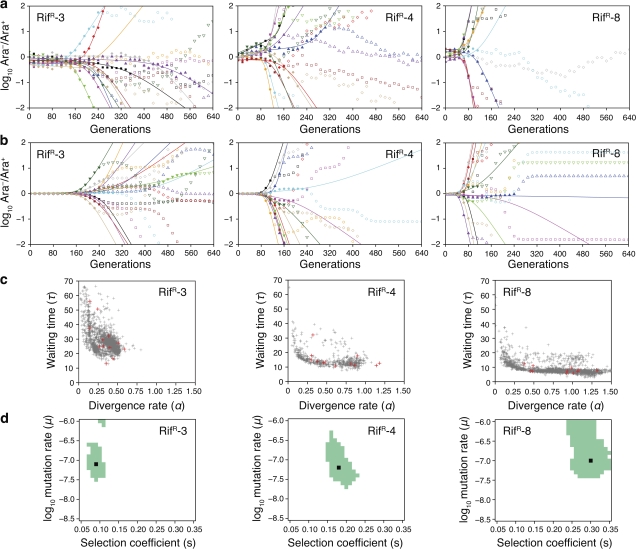
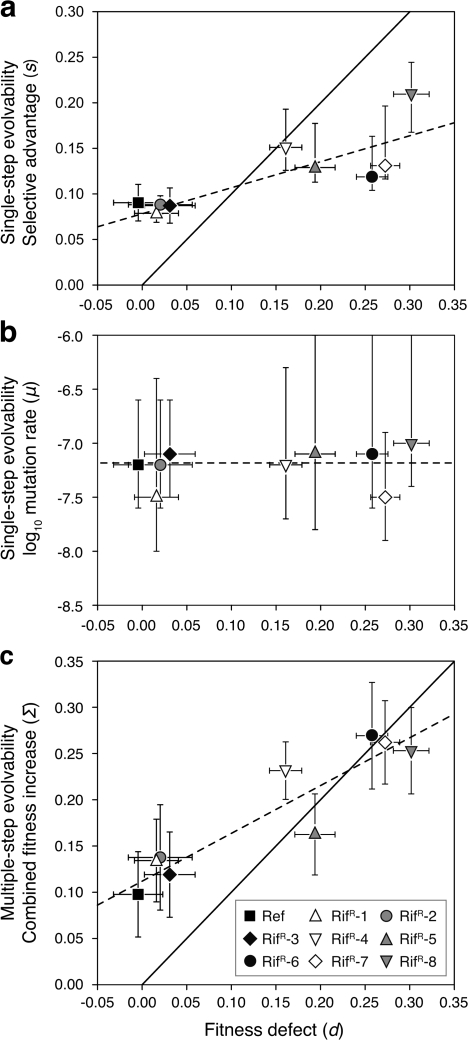
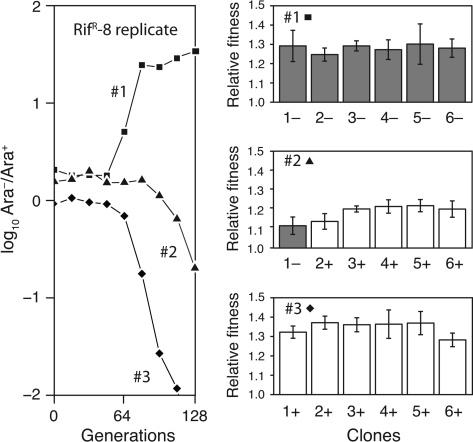
Evolvability is the capacity of an organism or population for generating descendants with increased fitness. Simulations and comparative studies have shown that evolvability can vary among individuals and identified characteristics of genetic architectures that can promote evolvability. However, little is known about how the evolvability of biological organisms typically varies along a lineage at each mutational step in its history. Evolvability might increase upon sustaining a deleterious mutation because there are many compensatory paths in the fitness landscape to reascend the same fitness peak or because shifts to new peaks become possible. We use genetic marker divergence trajectories to parameterize and compare the evolvability--defined as the fitness increase realized by an evolving population initiated from a test genotype--of a series of Escherichia coli mutants on multiple timescales. Each mutant differs from a common progenitor strain by a mutation in the rpoB gene, which encodes the beta subunit of RNA polymerase. Strains with larger fitness defects are proportionally more evolvable in terms of both the beneficial mutations accessible in their immediate mutational neighborhoods and integrated over evolutionary paths that traverse multiple beneficial mutations. Our results establish quantitative expectations for how a mutation with a given deleterious fitness effect should influence evolvability, and they will thus inform future studies of how deleterious, neutral, and beneficial mutations targeting other cellular processes impact the evolutionary potential of microorganisms.


Figures

F<sc>IG</sc>. 1.
FIG. 1.
Single-step evolvability inferred from marker ratio divergence trajectories. The RifR-3, RifR-4, and RifR-8 test genotypes illustrate the procedure for estimating the effective evolutionary parameters for the first beneficial mutations that sweep to high frequency in a test strain. (a) Experimental marker trajectories. The ratio of two marked variants (Ara/Ara+) of each test strain was monitored during a 640-generation evolution experiment. Each set of colored symbols represents an independently evolving replicate population (12 each for RifR-3 and RifR-4 and 11 for RifR-8). The marker ratio diverges from unity as beneficial mutations that occur in the genetic background of one marker state rise in frequency during the evolution experiment. Curves are fits to an empirical equation with parameters describing the waiting time (τ) and steepness (α) of the initial divergence. Fits include only the initial points of each marker trajectory (closed symbols) until goodness-of-fit tests fail (open symbols). In large populations such as these, the shape of initial divergence is often not attributable to a single beneficial mutation. Rather, it typically represents the superimposed effects of clonal interference between multiple competing beneficial mutations, some linked to each of the two marker states. In particular, certain marker curves that show delayed divergence may indicate that almost equally beneficial mutations arose nearly simultaneously in each of the two marker backgrounds. (b) Simulated marker trajectories. To infer a characteristic effective per-generation mutation rate (μ) and selective advantage (s) for the first successful beneficial mutations in a given strain background, we used stochastic population genetic simulations that include clonal interference to generate 200 theoretical marker divergence curves for each of 806 different (μ, s) combinations. The initial divergence of these trajectories was fit to the empirical equation to obtain a distribution of (α, τ) parameter pairs describing this family of curves. Twelve simulated marker trajectories, generated using μ and s values with the best agreement to the experimental data, are shown with initial divergence curves fit as in (a). (c) Empirical parameters. The distributions of α and τ empirical parameter pairs fit from experimental data (red crosses) and simulations (gray crosses) were compared using a 2D Kolmogorov–Smirnov test to reject those (μ, s) combinations where the initial divergence statistics differ significantly (P < 0.05) from the experimental data. The simulated distributions were generated using the μ and s values that provide the best agreement to the experimental data. τ values are expressed in units of transfers, and α values are per transfer, where one transfer is equal to eight generations. (d) Single-step evolvability. The effective evolutionary parameters μ and s measure the evolvability of each test strain in terms of the first beneficial mutations that sweep to fixation or near fixation under these conditions. Parameter combinations giving the best agreement between simulated and observed marker trajectories (black) and an estimated 95% confidence interval (green) are shown. Values of μ are per cell generation, and values of s are additive selection coefficients normalized to the fitness of each RifR ancestor. The edge of a discontinuous confidence interval for RifR-3 appears on the upper border of its graph. This region corresponds to a very high beneficial mutation rate that is not relevant to our experiment, as discussed in the text. See supplementary figures S1 and S2, Supplementary Material online, for graphs of the other six test strains, and see the Materials and Methods for full details of the analysis procedure.
F<sc>IG</sc>. 2.
FIG. 2.
Trends in single-step and multiple-mutation evolvability. The effects of deleterious RifR mutations and evolved beneficial mutations are reported as additive selection coefficients normalized to the fitness of the reference Escherichia coli strain. Thus, the competitive fitness of an evolved RifR strain relative to the reference strain is one minus its initial fitness defect (d) plus the first successful mutation’s selective advantage (s) or plus the net fitness increase over multiple mutations (Σ). (a) The effective selective advantage (s) inferred for the first beneficial mutations in each test strain plotted against that strain’s initial fitness defect (d). Replicate competition assays (n = 12) between each rpoB mutant and the ancestor strain were used to measure d (see Table 1). Values of s were inferred from a statistical analysis of marker divergence trajectories (see fig. 1). Error bars are 95% confidence intervals in both cases. The major axis regression line (dashed) and the line of equal fitness corresponding to the reference E. coli strain (solid) are shown. Values of s differ from those in figure 1 because they are reported here relative to the fitness of the reference strain to allow direct comparisons of fitness changes with d and Σ. We found no evidence of nontransitive fitness interactions that would invalidate this normalization procedure; that is, the fitness of each evolved RifR clone relative to its ancestor agreed with that predicted from its fitness measured relative to the reference strain and the fitness of its ancestor relative to the reference strain. (b) The effective rate at which the first successful beneficial mutations occur in each test strain (μ) plotted against that strain’s initial fitness defect (d). Values of μ were inferred from the marker divergence analysis (see fig. 1). Error bars are 95% confidence intervals. There is no significant trend in μ. The dashed line represents the average value over all strains. (c) The average fitness increase (Σ) for each test strain over the full 640-generation evolution experiment plotted against that strain’s initial fitness defect (d). Single competitions of each clone isolated at 640 generations, one from each independently evolved replicate (n = 12), against their oppositely marked rpoB mutant ancestors were used to measure Σ. These values were normalized relative to the reference strain’s fitness to allow direct comparisons of fitness changes with d and s. Error bars are 95% confidence limits. A separate set of competitions between evolved clones and the RifR reference strain that was used to establish transitivity gave essentially identical results. Trend lines are as described in (a). In all cases, this overall improvement in fitness is at least as great as the inferred single-step value, and most test strains appear to have reached at least the fitness level of the reference strain by this time.
F<sc>IG</sc>. 3.
FIG. 3.
Fitness measurements of individual clones isolated near the end of the first selective sweep agree with estimates from the marker divergence analysis. We isolated six clones from each of three representative RifR-8 populations at generation 128 and measured their fitness. The marker trajectories to this point are depicted on the left, and each bar on the right represents a clone isolated from the indicated RifR-8 population. Gray and white bars denote the fitness of Ara and Ara+ isolates, respectively, measured relative to the reciprocally marked RifR-8 ancestor strain in competition assays. Error bars are 95% confidence intervals estimated from replicate competitions (n = 6). Based on the marker divergence trajectory analysis, the effective selective advantage for the first single-step beneficial mutations to fix in the RifR-8 background is estimated as 0.30. For replicate populations #1 and #3, where one color dominates, the average fitnesses of the six evolved clones are 1.28 and 1.34, respectively. These values are thus in close agreement with the marker divergence estimate, and 10 of the 12 RifR-8 populations show marker dynamics similar to these examples (see fig. 1). In contrast, population #2 is one of two RifR-8 populations where the marker ratio trajectory diverged much more slowly. This difference appears to reflect, in part, clonal interference from beneficial mutations in the opposite marker background because an Ara (red) clone isolated from this population has a fitness of 1.12 ± 0.05 (95% confidence interval) relative to the ancestor. This population also appears to have not discovered mutations as beneficial as those found in most other populations, given that the average relative fitness of all Ara+ (white) clones is only 1.19 at generation 128. Overall, these measurements of evolved isolates are consistent with the conclusions of the marker divergence analysis regarding the average sizes of the first beneficial mutations to sweep in the Rif-8 background.

Similar articles

Cited by

References

    1. Ahrens JH, Dieter U. Computer generation of Poisson deviates from modified normal distributions. ACM Trans Math Software. 1982;8:163–179.
    1. Barrick JE, Lenski RE. Genome-wide mutational diversity in an evolving population of Escherichia coli. Cold Spring Harbor Symp Quant Biol. 2009 Advance Access published September 23, 2009, doi:10.1101/sqb.2009.74.018. - PMC - PubMed
    1. Barrick JE, Yu DS, Yoon SH, Jeong H, Oh TK, Schneider D, Lenski RE, Kim JF. Genome evolution and adaptation in a long-term experiment with Escherichia coli. Nature. 2009;461:1243–1247. - PubMed
    1. Bebbington AC. A simple method of drawing a sample without replacement. Appl Statist. 1975;24:136.
    1. Blount ZD, Borland CZ, Lenski RE. Historical contingency and the evolution of a key innovation in an experimental population of Escherichia coli. Proc Natl Acad Sci U S A. 2008;105:7899–7906. - PMC - PubMed

Publication types