. 2010 Mar 26;285(13):9716-9728.
doi: 10.1074/jbc.M109.073981. Epub 2010 Jan 27.

Inhibition of lung fluid clearance and epithelial Na+ channels by chlorine, hypochlorous acid, and chloramines

Affiliations

Inhibition of lung fluid clearance and epithelial Na+ channels by chlorine, hypochlorous acid, and chloramines

Weifeng Song et al. J Biol Chem. .

Abstract

We investigated the mechanisms by which chlorine (Cl(2)) and its reactive byproducts inhibit Na(+)-dependent alveolar fluid clearance (AFC) in vivo and the activity of amiloride-sensitive epithelial Na(+) channels (ENaC) by measuring AFC in mice exposed to Cl(2) (0-500 ppm for 30 min) and Na(+) and amiloride-sensitive currents (I(Na) and I(amil), respectively) across Xenopus oocytes expressing human alpha-, beta-, and gamma-ENaC incubated with HOCl (1-2000 microm). Both Cl(2) and HOCl-derived products decreased AFC in mice and whole cell and single channel I(Na) in a dose-dependent manner; these effects were counteracted by serine proteases. Mass spectrometry analysis of the oocyte recording medium identified organic chloramines formed by the interaction of HOCl with HEPES (used as an extracellular buffer). In addition, chloramines formed by the interaction of HOCl with taurine or glycine decreased I(Na) in a similar fashion. Preincubation of oocytes with serine proteases prevented the decrease of I(Na) by HOCl, whereas perfusion of oocytes with a synthetic 51-mer peptide corresponding to the putative furin and plasmin cleaving segment in the gamma-ENaC subunit restored the ability of HOCl to inhibit I(Na). Finally, I(Na) of oocytes expressing wild type alpha- and gamma-ENaC and a mutant form of beta ENaC (S520K), known to result in ENaC channels locked in the open position, were not altered by HOCl. We concluded that HOCl and its reactive intermediates (such as organic chloramines) inhibit ENaC by affecting channel gating, which could be relieved by proteases cleavage.


Figures

FIGURE 1.
FIGURE 1.
Exposure of mice to Cl2 decreases alveolar fluid clearance. A, C57BL/6 mice were exposed to the indicated concentrations of Cl2 gas for 30 min. Alveolar fluid clearance (expressed as % of instilled volume per 30 min) was measured 1 h post-exposure in anesthetized and ventilated mice as described under “Materials and Methods.” B, C57BL/6 mice exposed to 400 ppm Cl2 for 30 min. Alveolar fluid clearance was measured 1 h post-exposure. Amiloride (Am.; 1.5 mm final concentration) or an equivalent volume of vehicle was added in the instilled solution in some animals. C, measurements of AFC in BALB/C mice exposed to 400 ppm Cl2 and returned to room air for the indicated intervals. D, BALB/c mice were exposed to 400 ppm Cl2 for 30 min. Alveolar fluid clearance was measured in the presence and absence of amiloride (AMI; mean ± S.E.; *, p < 0.05 compared with the corresponding air value; #, p < 0.05 compared with the corresponding value without amiloride).
FIGURE 2.
FIGURE 2.
HOCl decreases Na+ currents across Xenopus oocytes injected with α-, β-, and γ-hENaC. A, oocytes injected with hENaC were perfused with either ND96 or a solution in which 0.8 mm HOCl was added in ND96 (0.8 mm HOCl-ND96). As mentioned under “Results” and shown in Fig. 4, the fast reaction of HOCl with HEPES and other compounds in ND96 mainly generated organic chloramines. Inward ENaC currents were measured by pulsing the membrane potential from its resting value (−40 mV) to −140 mV for 500 ms. Amiloride (AMI, 10 μm) was added into the perfusion medium at the times indicated by the arrows. To better demonstrate the effects of HOCl, the results were expressed as % of their corresponding base-line values before the addition of HOCl. Shown are characteristic tracings that were repeated using 10 different oocytes from three different isolations. B, current-voltage relationships of amiloride-sensitive difference (Iam) currents were obtained after perfusion of hENaC-expressing oocytes with either 0.8 mm HOCl-ND96 (open circles) or ND96 alone (closed squares) for 10 min. C, normalized amiloride-sensitive currents across hENaC-expressing oocytes were either incubated (open circles; n ≥ 8 for each data point) or perfused (solid circles; n ≥ 10 for each data point) with the indicated concentrations of HOCl-ND96 for 2 h and 10 min, respectively. Normalized amiloride-sensitive currents were calculated as follows as previously described (77); I = 1 − (Io − Ix)/(Io − Imax), where Io and Ix are the I values in the absence of HOCl and the maximum HOCl added. Inhibition constants (ki) were calculated using the Origin software by fitting the data points with the following equations; I = (1 − [1/(1 + Ki/x)])Imax, where Imax is the maximum current (i.e. the current in the absence of HOCl), and x is the concentration of HOCl. For clarity, only mean values (without S.E.) are shown. D, amiloride-sensitive currents (Iam) at −100 mV for hENaC-expressing oocytes were perfused with HOCl (400 μm), a mixture of HOCl (400 μm), and N-acetylcysteine (NAC, 1 mm) or N-acetylcysteine (1 mm) alone (mean ± S.E.; n ≥ 10 oocytes for each group. *, p < 0.05 compared with ND96 alone).
FIGURE 3.
FIGURE 3.
HOCl decreases Na+ single channel activity in cell-attached patches of hENaC-expressing oocytes. Oocytes were patched in the cell-attached mode as described under “Materials and Methods,” currents were measured at a pipette holding potential of −100 mV (Vholding = VapicalPpipette), and amplitude distribution histograms were generated as described under “Materials and Methods.” Control (A) and 10-min post-perfusion with 2 mm HOCl-ND96 record (B) is shown. Open (O) and closed (C) states are indicated on the records. Notice a visible decrease of open state of single channels in HOCl-perfused oocytes. Typical records are from five control and five HOCl-perfused oocytes from two different batches. C, amplitude histograms for single channels from control (black) and HOCl perfused (red) oocytes are shown in A and B. D, NPo values were calculated from all amplitudes histograms as mentioned under “Materials and Methods” (mean ± S.E.; n = 5; **, p < 0.01).
FIGURE 4.
FIGURE 4.
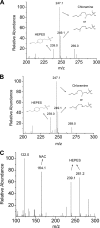
Mass spectrometry analysis of reaction products formed by the reaction of HOCl with ND96. 2.5 mm HOCl were added into ND96 for 1 and 6 h. Samples of medium were then analyzed with tandem mass spectroscopy as discussed under “Materials and Methods.” Records show the mass-to-charge ratios (m/z) for the various fragments formed by the interaction of HOCl with ND96. Possible structures of the most abundant compounds (organic chloramines) formed after 1 (A) and 6 h (B) post-addition are shown as insets. Notice the absence of these organic chloramines 1 h post-HOCl (400 μm) addition into ND96 containing N-acetylcysteine (NAC, 1 mm) (C). Typical records were reproduced at least three times with identical results.
FIGURE 5.
FIGURE 5.
Inhibition of INa by glycine and taurine chloramines formed in the absence of HEPES. Inward Na+ currents at −100 mV across hENaC-expressing oocytes perfused for 10 min with (A) glycine (10 mm) in phosphate buffer or glycine (10 mm) and 2 mm HOCl in phosphate buffer (PBS) and taurine (10 mm) in phosphate buffer or taurine (10 mm) and 2 m HOCl in phosphate buffer (B). Glycine or taurine were mixed with HOCl in phosphate buffer for 1 h before perfusion (no HEPES present). Amiloride (Am., 10 μm) and DTT (10 mm) were added into the medium 10 min post perfusion (mean ± S.E. for the indicated number of oocytes; *, p < 0.05).
FIGURE 6.
FIGURE 6.
Trypsin, plasmin, and elastase increase INa after HOCl inhibition. A, hENaC-expressing oocytes were perfused with 2 mm HOCl-ND96 for 10 min. Inward Na+ currents were measured continuously at −100 mV as described under “Materials and Methods.” After 10 min, oocytes were perfused with ND96 containing 100 nm trypsin, which rapidly increased the currents to the control level. Subsequent addition of amiloride (Ami, 10 μm) into the perfusate decreased the currents to almost zero (recording was discontinued). B–D, mean values for the experiment are shown after perfusion with trypsin (Tryp, 100 nm; B; n = 8), elastase (Elas, 10 μg/ml; C; n = 6), or plasmin (Plas, 10 μg/ml; D; n = 6) (mean ± S.E., *, p < 0.05). Cont, control.
FIGURE 7.
FIGURE 7.
Serine proteases renders ENaC insensitive to HOCl. A, hENaC-expressing oocytes were perfused with ND96 containing 100 nm trypsin. Inward Na+ currents were measured continuously at −100 mV as described under “Materials and Methods.” After 5 min, when the INa had reached a new plateau, oocytes were perfused with 2 mm HOCl-ND96, which had no effect on INa. Subsequent addition of amiloride (Ami, 10 μm) into the perfusate decreased INa to almost zero. B–D, mean values are shown for the corresponding experiments after perfusion of hENaC-expressing oocytes with trypsin (Tryp, 100 nm; B; n = 11), elastase (Elas, 10 μg/ml; C; n = 8), or plasmin (Plas, 10 μg/ml; D; n = 6) (means ± S.E. *. p < 0.05). Cont, control.
FIGURE 8.
FIGURE 8.
Trypsin has little effect on INa inhibited by HOCl incubation. A, shown is a representative time course recordings of INa at −100 mV from hENaC-expressing oocytes perfused by 1 mm HOCl-ND96 (●) or incubated in 100 μm HOCl-ND96 for 2 h (○), then perfused with trypsin (Try, 2 μm) and amiloride (Ami, 10 μm). B, group data showed trypsin increased INa to control levels in oocytes perfused with HOCl-ND96. Incubation (Incu) with HOCl-ND96 for 2 h greatly inhibited INa, and perfusion with trypsin had little effect on INa of these oocytes (mean ± S.E., n = 11 for HOCl-perfused and 5 for HOCl-incubated oocytes; *, p < 0.05).
FIGURE 9.
FIGURE 9.
Lack of inhibition of INa by chloramines after treatment of oocytes with various concentrations of trypsin. hENaC-expressing oocytes were preincubated with the indicated concentrations of trypsin for 10 min and then perfused with 1 mm HOCl-ND96 for 10 min, at which time amiloride (Ami, 10 μm) was added in the bath (mean ± S.E.). Cont, control.
FIGURE 10.
FIGURE 10.
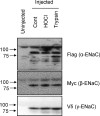
HOCl does not decrease cell membrane ENaC levels. Xenopus oocytes expressing tagged α-, β-, and γ-hENaC were incubated with ND96 (Cont) or 2 mm HOCl-ND96 (HOCl) for 10 min. In another set of experiments, hENaC-expressing oocytes were first incubated with trypsin (100 nm) for 10 min and then with 2 mm HOCl-ND96 (Trypsin). Equal amounts of membrane extracts from each treatment group were resolved by SDS-PAGE and blotted with anti-FLAG, Myc, and V5 antibodies to determine the levels of α-, β-, and γ-ENaC on the plasma membrane. Shown are the results of a typical experiment, which was repeated three times with identical results.
FIGURE 11.
FIGURE 11.
Oocyte protease activity is not inhibited by HOCl. hENaC-expressing oocytes were incubated with ND96 as control (○) or 2 mm HOCl-ND96 (●) for 10 min, then moved into a cuvette containing Boc-Gln-Ala-Arg-AMC-HCl (50 μm). Fluorescence was measured continuously for the next 20 min at 460 nm after excitation at 380 nm (mean ± S.E.; n = 5 for each condition).
FIGURE 12.
FIGURE 12.
HOCl inhibits ENaC by interaction with a peptide in the extracellular loop of γ-subunit. A, shown is a partial sequence (136–203 amino acids) within the finger domain in the extracellular loop of γ-ENaC including the putative furin (Arg-143), plasmin (Lys-194), and elastase (Ala-195 and Val-198) cleavage sites (shown in bold font). A 51-mer peptide was synthesized corresponding to the segment between furin and plasmin cleavage sites (144–194, in italics). B, left panel (−HOCl), hENaC-expressing oocytes were perfused with plasmin (10 μg/ml) followed by ND96 containing the 51-mer peptide and then amiloride (10 μm). Right panel (+HOCl), after activation of hENaC by plasmin perfusion, oocytes were perfused with the mixture of 2 mm HOCl-ND96 and the peptide (3 μg/ml) (mean ± S.E.; n = 6 for each group; *, p < 0.05 compared with control). Cont, control.
FIGURE 13.
FIGURE 13.
INa of βS520K mutant ENaC is not inhibited by HOCl. A, shown are representative time-course recordings of INa at −100 mV from oocytes expressing wild type α,βS520K and wild-type γ-ENaC perfused with HOCl-ND96 (1 mm) for 10 min (●) or incubated with HOCl-ND96 (100 μm) for 2 h (○), then perfused with trypsin (Try, 2 μm) and amiloride (Ami, 10 μm). B, group data showed neither perfusion nor incubation with HOCl-ND96 inhibits INa of βS520K mutant ENaC-expressing oocytes (mean ± S.E., n = 14 for HOCl perfused and 5 for HOCl incubated oocytes). Cont, control.
FIGURE 14.
FIGURE 14.
Intratracheal trypsin reverses the decrease in AFC in mice exposed to Cl2. BALB/c mice were exposed to Cl2 (300 ppm for 30 min) and then returned to room air. Fifteen minutes post-exposure, they were briefly anesthetized with isoflurane, and trypsin (5 μm; dissolved in 100 μl of saline) was instilled dropwise in the nostrils. Mice recovered quickly, and 1 h post-exposure, they were anesthetized and ventilated, and AFC was measured (mean ± S.E.; control = 12; saline = 8; trypsin = 5. *, p < 0.05).

Similar articles

Cited by

References

    1. Matalon S., O'Brodovich H. (1999) Annu. Rev. Physiol. 61, 627–661 - PubMed
    1. Song W., Matalon S. (2007) Am. J. Physiol. Lung Cell Mol. Physiol. 293, L855–LL858 - PubMed
    1. Matthay M. A., Folkesson H. G., Clerici C. (2002) Physiol. Rev. 82, 569–600 - PubMed
    1. Nielsen V. G., Duvall M. D., Baird M. S., Matalon S. (1998) Am. J. Physiol. 275, L1127–L1133 - PubMed
    1. Fang X., Song Y., Hirsch J., Galietta L. J., Pedemonte N., Zemans R. L., Dolganov G., Verkman A. S., Matthay M. A. (2006) Am. J. Physiol. Lung Cell Mol. Physiol. 290, L242–LL249 - PubMed

Publication types

LinkOut - more resources