. 2010 Mar;152(3):1674-92.
doi: 10.1104/pp.109.152157. Epub 2010 Jan 27.

The submergence tolerance regulator Sub1A mediates stress-responsive expression of AP2/ERF transcription factors

Affiliations

The submergence tolerance regulator Sub1A mediates stress-responsive expression of AP2/ERF transcription factors

Ki-Hong Jung et al. Plant Physiol. 2010 Mar.

Abstract

We previously characterized the rice (Oryza sativa) Submergence1 (Sub1) locus encoding three ethylene-responsive factor (ERF) transcriptional regulators. Genotypes carrying the Sub1A-1 allele are tolerant of prolonged submergence. To elucidate the mechanism of Sub1A-1-mediated tolerance, we performed transcriptome analyses comparing the temporal submergence response of Sub1A-1-containing tolerant M202(Sub1) with the intolerant isoline M202 lacking this gene. We identified 898 genes displaying Sub1A-1-dependent regulation. Integration of the expression data with publicly available metabolic pathway data identified submergence tolerance-associated pathways governing anaerobic respiration, hormone responses, and antioxidant systems. Of particular interest were a set of APETALA2 (AP2)/ERF family transcriptional regulators that are associated with the Sub1A-1-mediated response upon submergence. Visualization of expression patterns of the AP2/ERF superfamily members in a phylogenetic context resolved 12 submergence-regulated AP2/ERFs into three putative functional groups: (1) anaerobic respiration and cytokinin-mediated delay in senescence via ethylene accumulation during submergence (three ERFs); (2) negative regulation of ethylene-dependent gene expression (five ERFs); and (3) negative regulation of gibberellin-mediated shoot elongation (four ERFs). These results confirm that the presence of Sub1A-1 impacts multiple pathways of response to submergence.


Figures

Figure 1.
Figure 1.
Quality test of samples used for the microarray experiment. Expression patterns are for marker genes for microarray experiments. Ubiquitin5 (Ubi5; Os01g22490.1) and Elongation factor1a (Ef1a; Os03g08010.1) genes were used as internal controls for RT-PCR. RNA was extracted from M202(Sub1) and M202 at 0, 1, and 6 d after submergence.
Figure 2.
Figure 2.
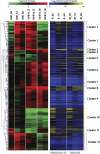
HCL analysis of candidate genes showing significant differential expression patterns after submergence. The left panel displays log2 fold ratios from seven comparisons, and the right panel represents log2-transformed normalized intensity in six samples used for this microarray experiment of each probe. Red indicates up-regulation in M202(Sub1) compared with M202 after submergence, in M202(Sub1) after submergence compared with before submergence, and in M202 after submergence compared with before submergence, and green indicates down-regulation for the same comparisons. Blue indicates background level of expression, and yellow indicates high level of expression. Various colored boxes indicate clusters showing similar tendencies of gene expression. Later, clusters 1, 2, 3, 6, 7, 8, and 9 were applied for Figure 6 and Supplemental Figure S3, and clusters 4, 5, 10, and 11 were applied for Supplemental Figures S5 and S6. S/M_0 d, Log2 ratio of M202(Sub1) compared with M202 before submergence; S/M_1 d, log2 ratio of M202(Sub1) compared with M202 at 1 d after submergence; S/M_6 d, log2 ratio of M202(Sub1) compared with M202 at 6 d after submergence; 1 d/0 d_S, log2 ratio of M202(Sub1) at 1 d after submergence compared with before submergence; 6 d/0 d_S, log2 ratio of M202(Sub1) at 6 d after submergence compared with before submergence; 1 d/0 d_M, log2 ratio of M202 at 1 d after submergence compared with before submergence; 6 d/0 d_M, log2 ratio of M202 at 6 d after submergence compared with before submergence. The blue-yellow bar indicates log2-transformed normalized expression levels of Affymetrix and NSF45K array data, and the range is from 14 to 6. The green-red bar indicates fold change values of seven comparisons in NSF45K array data, and the range is from −2 to 2. [See online article for color version of this figure.]
Figure 3.
Figure 3.
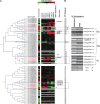
Phylogenomic digital expression analysis of the AP2/ERF family and validation of expression patterns of 12 downstream AP2/ERF genes of Sub1A-1. A, Phylogenomic digital expression analysis of 86 AP2/ERF TFs including three groups (i.e. VIIa, VIIIa, and IIIc) that are positively involved in Sub1A-1 function. Phylogenomic digital expression analysis of all AP2/ERF genes (182) is presented in Supplemental Figure S1. B, Validation of gene expression patterns of 11 AP2/ERF genes downstream of Sub1A-1. Gene models colored red in A were at least 2-fold up-regulated in M202(Sub1) compared with M202 at 1 d after submergence; a gene model colored green in A was more than 2-fold down-regulated in M202(Sub1) compared with M202 at 1 d after submergence; and gene models colored light blue in A were 1.4- to 2-fold down-regulated in M202(Sub1) compared with M202 at 1 d after submergence. See Figure 2 legend for the heat map. [See online article for color version of this figure.]
Figure 4.
Figure 4.
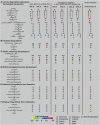
Functional assignment of three AP2/ERF groups for Sub1A-1 function with integrating GO terms and publicly available gene expression data. The left panel displays log2 fold changes from gene expression data to compare anoxic versus aerobic coleoptiles, trans-zeatin (tZ) versus dimethyl sulfoxide (DMSO) in root and leaf (GSE6737), abiotic stresses (i.e. drought, salt, and cold) versus untreated control (GSE6901), M. grisea (FR13) versus mock treatment (GSE7256; Hirose et al., 2007; Jain et al., 2007), and seven comparisons used in Figure 2 from NSF45K array data. The right panel provides the names of the AP2/ERF groups, locus identifiers (ID) based on Osa1 version 5.0, and names of GO terms assigned to each AP2/ERF gene. See Figure 2 legend for the heat map. [See online article for color version of this figure.]
Figure 5.
Figure 5.
Identification of conserved cis-acting elements in significant AP2/ERF genes for Sub1A-1 function. We used the MEME tool to find consensus cis-acting elements in the promoter regions of AP2/ERF genes in each of four groups. For each group, we provide four putative cis-acting elements with lowest E-value calculated via the Web server (http://meme.nbcr.net). Numerals 1 to 4 resulted from MEME searches for group IIIc; 5 to 8 resulted from MEME searches for a group consisting of Sub1B, Sub1C, Os03g08490, Os04g46220, and Os03g64260 in negative association with Sub1A-1 function except Sub1B. Analyses for VIIa and VIIIa are presented in Supplemental Figure S2. In total, eight consensus sequence LOGOs are represented here and an additional eight for VIIa and VIIIa are represented in Supplemental Figure S2, and the MEME tool automatically produced the LOGO. Query indicates the sequence LOGO used to search for matches to known TF-binding motifs; Target is the name of the putative TF binding to the sequence LOGO resulting from MAST searches; Class is the name of the gene family including the target; and P value represents the probability of obtaining a result and target identified with P < 0.05. Unknown, Absence of target identified with P < 0.05 as a result of MAST. Green boxes indicate LOGOs binding to AP2/ERF TF; blue boxes indicate C2H2-type zinc finger protein; and light blue boxes indicate unknown. Numerals at bottom indicate the positions of nucleotides starting from ATG. [See online article for color version of this figure.]
Figure 6.
Figure 6.
Integration of gene expression data and metabolic pathways to identify pathways positively involved in Sub1A-1 function. Genes associated with Suc degradation/glycolysis/fermentation (A), trehalose biosynthesis (B), dTDP-l-Rha biosynthesis (C), UDP-N-acetylgalactosamine biosynthesis (D), and Ile biosynthesis from Thr (E) pathways are coexpressed and show positive association with Sub1A-1 function and up-regulation in anoxic coleoptiles. Ethylene biosynthesis from the Met pathway (F) is up-regulated in M202(Sub1) and M202 after submergence but repressed in anoxic coleoptiles. For this figure, we used log2 fold ratios of seven comparisons in Figure 2 and comparison of anoxic versus aerobic coleoptiles with the Affymetrix array from a public microarray database (NCBI GEO; http://www.ncbi.nlm.nih.gov/geo/) and integrated the data to the RiceCyc Omics Viewer (http://pathway.gramene.org/RICE/expression.html). Expression patterns of candidate genes are marked as colored lines. See Figure 2 legend for a description of the seven comparisons. [See online article for color version of this figure.]
Figure 7.
Figure 7.
Summary of Sub1A-1-mediated submergence tolerance responses revealed with integrating omics tools. Orange boxes indicate events up-regulated in M202(Sub1) after submergence, and light blue boxes indicate events down-regulated in M202(Sub1) after submergence. The orange arrow indicates activation of downstream events; black lines represent repression of downstream events; solid lines indicate validated events; and dotted lines indicate predicted events. The red open box designates the functional roles executed by AP2/ERF genes in three groups in positive association with Sub1A-1. PDC, Pyruvate decarboxylase. [See online article for color version of this figure.]

Similar articles

Cited by

References

    1. Ahn IP. (2008) Glufosinate ammonium-induced pathogen inhibition and defense responses culminate in disease protection in bar-transgenic rice. Plant Physiol 146: 213–227 - PMC - PubMed
    1. Almeida AM, Vriezen WH, Van der Straeten D. (2003) Molecular and physiological mechanisms of flooding avoidance and tolerance in rice. Russ J Plant Physiol 50: 743–751
    1. Alonso JM, Stepanova AN, Leisse TJ, Kim CJ, Chen H, Shinn P, Stevenson DK, Zimmerman J, Barajas P, Cheuk R, et al. (2003) Genome-wide insertional mutagenesis of Arabidopsis thaliana. Science 301: 653–657 - PubMed
    1. Bailey TL, Williams N, Misleh C, Li WW. (2006) MEME: discovering and analyzing DNA and protein sequence motifs. Nucleic Acids Res 34: W369–W373. - PMC - PubMed
    1. Bailey-Serres J, Voesenek LA. (2008) Flooding stress: acclimations and genetic diversity. Annu Rev Plant Biol 59: 313–339 - PubMed

Publication types