

Gamma-phase shifting in awake monkey visual cortex
- PMID: 20107053
- PMCID: PMC6633799
- DOI: 10.1523/JNEUROSCI.1623-09.2010
Gamma-phase shifting in awake monkey visual cortex
Abstract
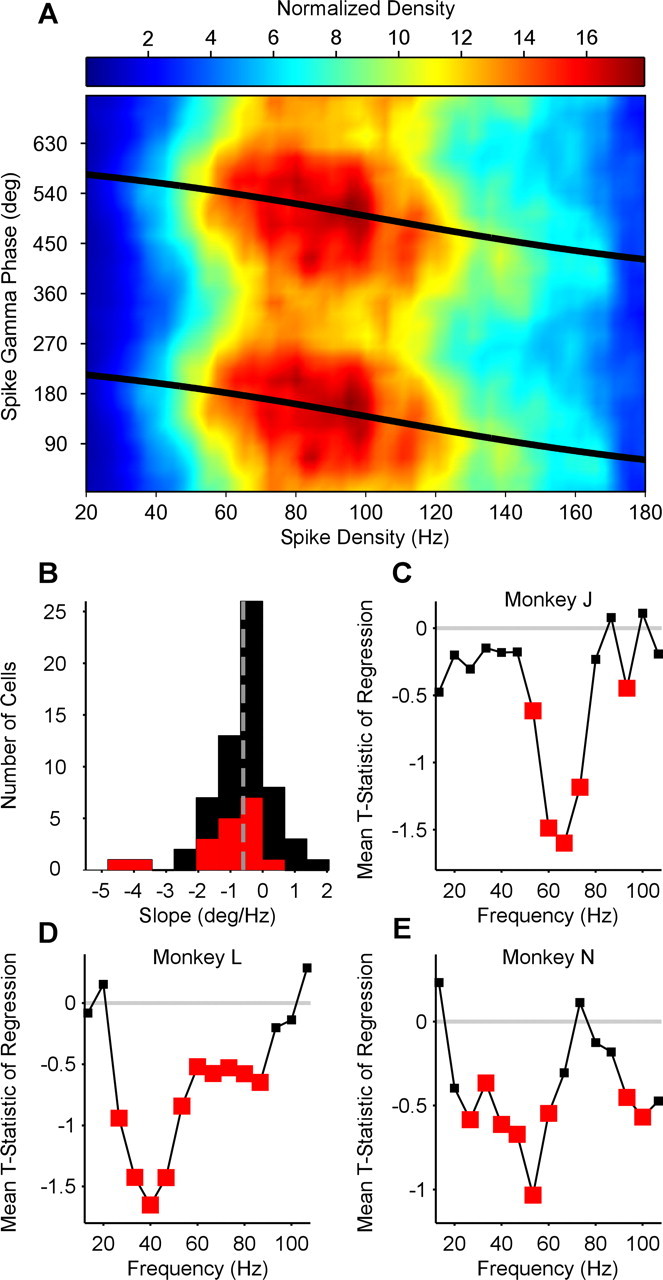
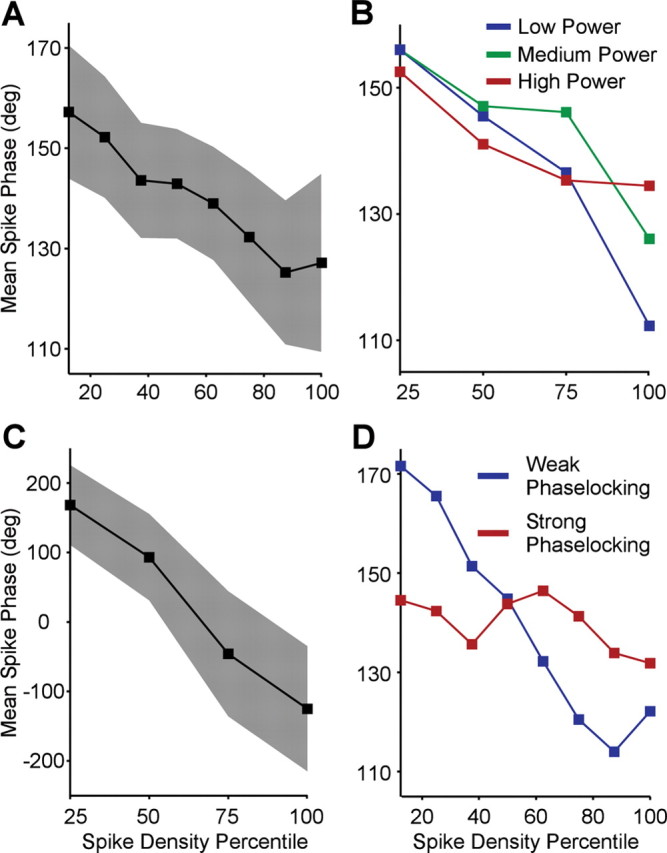
Gamma-band synchronization is abundant in nervous systems. Typically, the strength or precision of gamma-band synchronization is studied. However, the precise phase with which individual neurons are synchronized to the gamma-band rhythm might have interesting consequences for their impact on further processing and for spike timing-dependent plasticity. Therefore, we investigated whether the spike times of individual neurons shift systematically in the gamma cycle as a function of the neuronal activation strength. We found that stronger neuronal activation leads to spikes earlier in the gamma cycle, i.e., we observed gamma-phase shifting. Gamma-phase shifting occurred on very rapid timescales. It was particularly pronounced for periods in which gamma-band synchronization was relatively weak and for neurons that were only weakly coupled to the gamma rhythm. We suggest that gamma-phase shifting is brought about by an interplay between overall excitation and gamma-rhythmic synaptic input and has interesting consequences for neuronal coding, competition, and plasticity.
Figures
Similar articles
-
Adaptive changes in neuronal synchronization in macaque V4.J Neurosci. 2011 Sep 14;31(37):13204-13. doi: 10.1523/JNEUROSCI.6227-10.2011. J Neurosci. 2011. PMID: 21917803 Free PMC article.
-
Unbiased and robust quantification of synchronization between spikes and local field potential.J Neurosci Methods. 2016 Aug 30;269:33-8. doi: 10.1016/j.jneumeth.2016.05.004. Epub 2016 May 13. J Neurosci Methods. 2016. PMID: 27180930
-
Regulation of spike timing in visual cortical circuits.Nat Rev Neurosci. 2008 Feb;9(2):97-107. doi: 10.1038/nrn2315. Nat Rev Neurosci. 2008. PMID: 18200026 Free PMC article. Review.
-
A multielectrode study of the inferotemporal cortex in the monkey: effects of grouping on spike rates and synchrony.Neuroreport. 2006 Mar 20;17(4):407-11. doi: 10.1097/01.wnr.0000203349.22128.e0. Neuroreport. 2006. PMID: 16514367
-
Synchronous neural activity and memory formation.Curr Opin Neurobiol. 2010 Apr;20(2):150-5. doi: 10.1016/j.conb.2010.02.006. Epub 2010 Mar 18. Curr Opin Neurobiol. 2010. PMID: 20303255 Free PMC article. Review.
Cited by
-
Ripples reflect a spectrum of synchronous spiking activity in human anterior temporal lobe.Elife. 2021 Nov 15;10:e68401. doi: 10.7554/eLife.68401. Elife. 2021. PMID: 34779398 Free PMC article.
-
Investigating large-scale brain dynamics using field potential recordings: analysis and interpretation.Nat Neurosci. 2018 Jul;21(7):903-919. doi: 10.1038/s41593-018-0171-8. Epub 2018 Jun 25. Nat Neurosci. 2018. PMID: 29942039 Free PMC article. Review.
-
Cortical travelling waves: mechanisms and computational principles.Nat Rev Neurosci. 2018 May;19(5):255-268. doi: 10.1038/nrn.2018.20. Epub 2018 Mar 22. Nat Rev Neurosci. 2018. PMID: 29563572 Free PMC article. Review.
-
Stimulus-specific plasticity in human visual gamma-band activity and functional connectivity.Elife. 2021 Aug 24;10:e68240. doi: 10.7554/eLife.68240. Elife. 2021. PMID: 34473058 Free PMC article.
-
The Neural Engine: A Reprogrammable Low Power Platform for Closed-Loop Optogenetics.IEEE Trans Biomed Eng. 2020 Nov;67(11):3004-3015. doi: 10.1109/TBME.2020.2973934. Epub 2020 Feb 21. IEEE Trans Biomed Eng. 2020. PMID: 32091984 Free PMC article.
References
Publication types
MeSH terms
LinkOut - more resources
Full Text Sources
Other Literature Sources