. 2010 Jan 27;30(4):1337-47.
doi: 10.1523/JNEUROSCI.3481-09.2010.

Cell type-specific long-term plasticity at glutamatergic synapses onto hippocampal interneurons expressing either parvalbumin or CB1 cannabinoid receptor

Affiliations

Cell type-specific long-term plasticity at glutamatergic synapses onto hippocampal interneurons expressing either parvalbumin or CB1 cannabinoid receptor

Wiebke Nissen et al. J Neurosci. .

Abstract

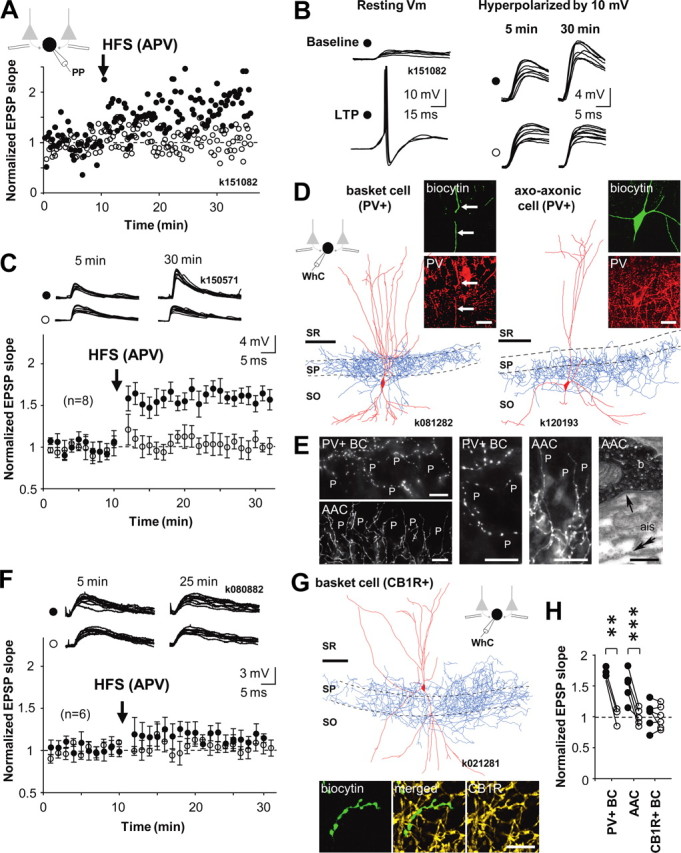
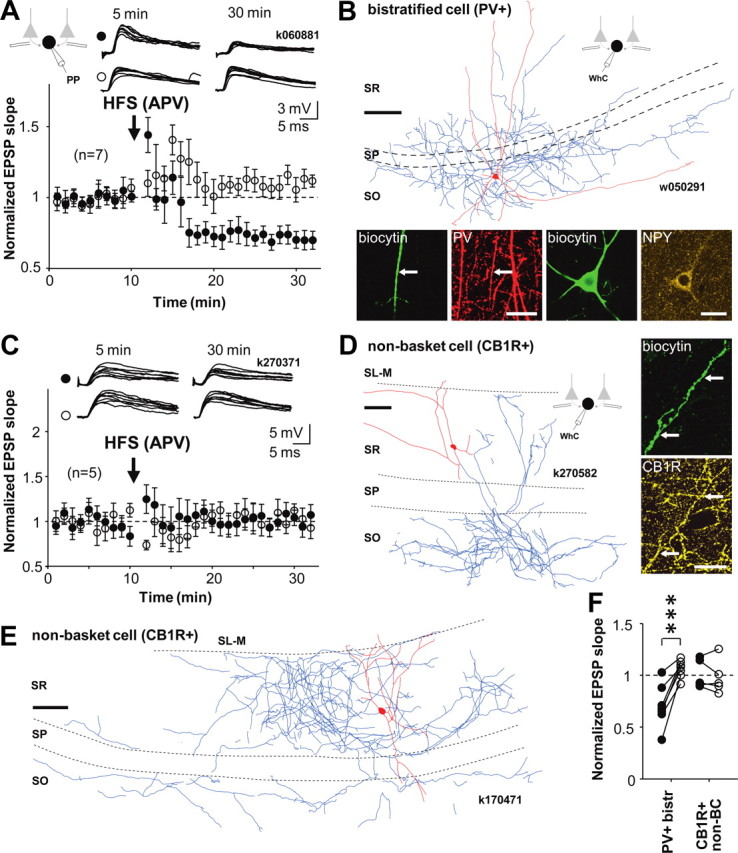
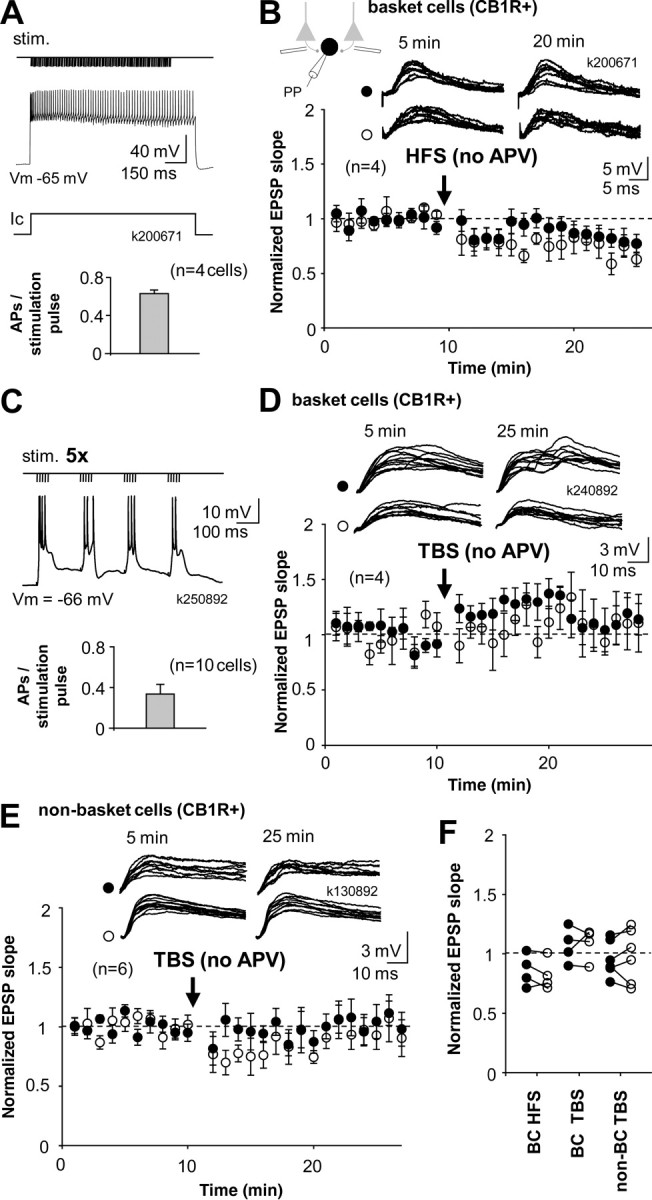
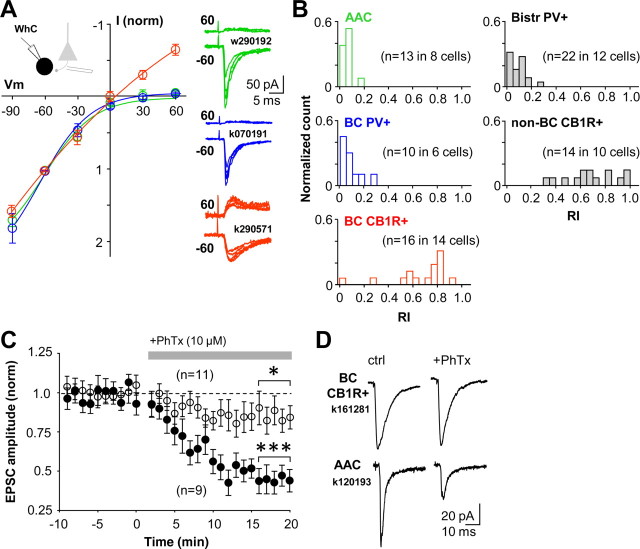
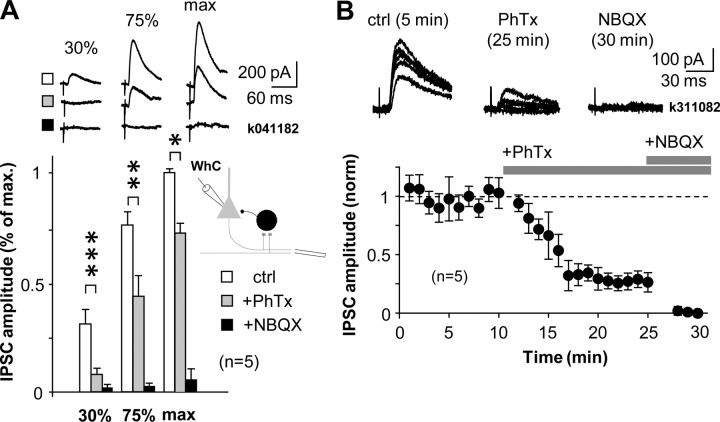
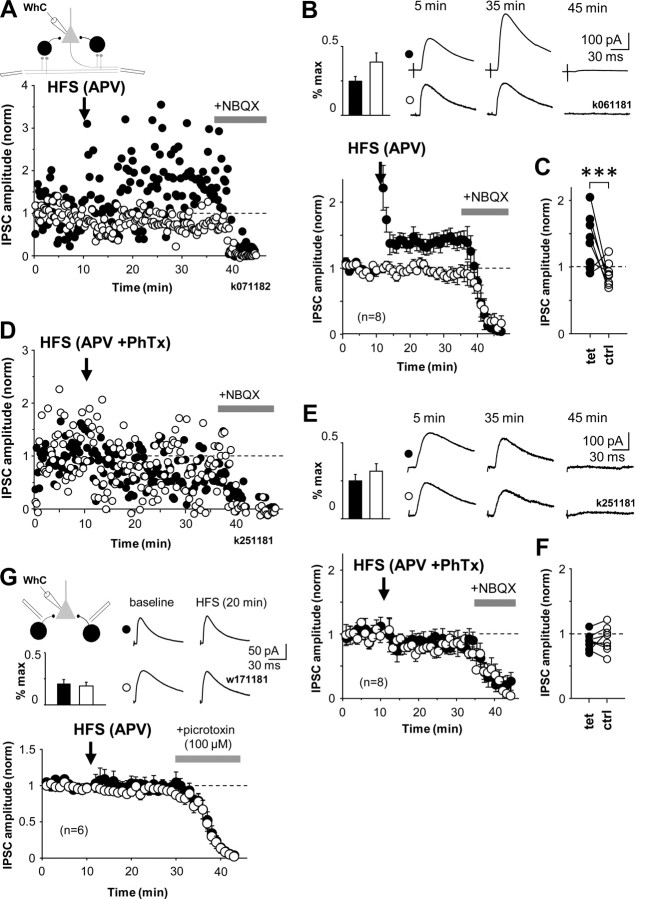
Different GABAergic interneuron types have specific roles in hippocampal function, and anatomical as well as physiological features vary greatly between interneuron classes. Long-term plasticity of interneurons has mostly been studied in unidentified GABAergic cells and is known to be very heterogeneous. Here we tested whether cell type-specific plasticity properties in distinct GABAergic interneuron types might underlie this heterogeneity. We show that long-term potentiation (LTP) and depression (LTD), two common forms of synaptic plasticity, are expressed in a highly cell type-specific manner at glutamatergic synapses onto hippocampal GABAergic neurons. Both LTP and LTD are generated in interneurons expressing parvalbumin (PV+), whereas interneurons with similar axon distributions but expressing cannabinoid receptor-1 show no lasting plasticity in response to the same protocol. In addition, LTP or LTD occurs in PV+ interneurons with different efferent target domains. Perisomatic-targeting PV+ basket and axo-axonic interneurons express LTP, whereas glutamatergic synapses onto PV+ bistratified cells display LTD. Both LTP and LTD are pathway specific, independent of NMDA receptors, and occur at synapses with calcium-permeable (CP) AMPA receptors. Plasticity in interneurons with CP-AMPA receptors strongly modulates disynaptic GABAergic transmission onto CA1 pyramidal cells. We propose that long-term plasticity adjusts the synaptic strength between pyramidal cells and interneurons in a cell type-specific manner and, in the defined CA1 interneurons, shifts the spatial pattern of inhibitory weight from pyramidal cell dendrites to the perisomatic region.


Figures

Figure 1.
Figure 1.
Cell type-specific LTP in interneurons innervating the perisomatic domain of pyramidal cells. A–G, LTP is generated in PV+ basket cells and axo-axonic cells but not in basket cells expressing CB1R. Recordings were made in perforated patch; cells were repatched in whole cell for post hoc identification using biocytin labeling. A, Pathway-specific LTP in a PV+ basket cell. Two glutamatergic afferent pathways were stimulated with electrodes in str. oriens/alveus. After baseline period, HFS (100 Hz, 1 s, two times) was delivered to one pathway (filled symbols), whereas the other pathway served as control (open symbols). Schematic shows experimental design during perforated patch (PP) recording. Timing of HFS is indicated by an arrow. During HFS, the postsynaptic cell was voltage clamped to −70 mV. Potentiation of EPSP lasted at least 25 min and was restricted to the stimulated pathway. B, Consecutive EPSPs in the basket cell in A during baseline and 20 min after the HFS. Left, EPSP at resting membrane potential (resting Vm) triggered action potentials after LTP. To avoid action potentials, EPSPs were recorded during a hyperpolarizing step (−10 mV) throughout the experiment. Symbols indicate tetanized and control pathways as in A. C, EPSP slope mean ± SE in eight identified perisomatic-targeting PV+ interneurons. Data include three PV+ basket cells and five axo-axonic cells, and symbols indicate tetanized and control pathway as in A. Top, Consecutive EPSPs in the two pathways during baseline and 20 min after the HFS. D, Digital visualization of PV+ basket cell k081282 (left; dendrites in red from two 70-μm-thick sections, axon in blue, from one section) and axo-axonic cell k120193 (right, one section) recorded in whole cell (WhC). Images produced from confocal microscopic image stacks. Scale bar, 100 μm. Insets, Immunofluorescence micrographs of the labeled cells demonstrating the expression of PV in the dendrites (indicated by arrow) and soma of the cells. Laser confocal microscope images; biocytin is in green and PV is in red. Scale bar, 20 μm. SR, str. radiatum; SP, str. pyramidale; SO, str. oriens. E, Distinct axonal patterns of a basket cell and an axo-axonic cell within the pyramidal cell layer. Left, Epifluorescent micrographs of a PV+ basket cell (PV+ BC, k151082) showing undulating bouton laden axon collaterals, often running parallel with the pyramidal cell layer, among pyramidal cells (P), and an axo-axonic cell (AAC, k100871), showing their characteristic radial bouton bundles. The axo-axonic bouton rows follow axon initial segments of pyramidal cells (P) toward str. oriens. Scale bar, 20 μm. Middle, Higher-magnification epifluorescent micrographs of the same PV+ basket cell (PV+ BC, middle left) and axo-axonic cell (AAC, middle right). Scale bar, 20 μm. Right, Electron micrograph showing a synapse (arrow) received by an axon initial segment (ais) from a bouton (b) of axo-axonic cell k100871. The bouton is identified by the electron opaque HRP end product and the ais by the membrane undercoating (double arrow). Scale bar, 0.25 μm. F, EPSPs in basket cells expressing CB1R do not show lasting plasticity. EPSP slope mean ± SE in six basket cells tested for LTP and plotted as above. Top, EPSPs during baseline and 15 min after the HFS. G, Visualization of one CB1R+ basket cell by digital rendering of fluorescent images (two superimposed 70-μm-thick sections). Scale bar, 100 μm. Bottom, Immunofluorescence micrographs of a biocytin-labeled (green) axon segment (CB1R, yellow, laser confocal image). Scale bar, 10 μm. H, Comparison of baseline-normalized average EPSPs in all perisomatic-targeting cells 15–20 min after HFS relative to control pathways. Filled symbols indicate tetanized pathway, and open symbols show the control pathway. LTP is consistent in the PV+ interneuron types. Significance levels indicate a difference between pathways (**p < 0.01, ***p < 0.005, unpaired t test).
Figure 2.
Figure 2.
LTP is specific to perisomatic-targeting PV+ cell types. EPSPs in PV+ bistratified cells that target to the dendritic domain of CA1 pyramidal cells show LTD. EPSPs in interneurons that express CB1R and innervate pyramidal cell dendrites show no lasting plasticity. Perforated patch (PP) recordings. A, Mean ± SE of EPSP slope in seven identified bistratified cells. HFS to one of the pathways (filled symbols) induced pathway-specific LTD. Open symbols show EPSP in the untetanized control pathway. Top, Consecutive EPSP traces during baseline and 20 min after the HFS in the two pathways. Schematic shows experimental design. B, Visualization of one bistratified cell by digital rendering of fluorescent images (dendrites in red and axon in blue, from one 70 μm section) recorded in whole cell (WhC). Scale bar, 100 μm. Fluorescence micrographs demonstrating immunopositivity for PV (red, laser confocal images) as tested in a dendrite (indicated by arrow) and for neuropeptide Y (yellow, structured illumination microscope images) in the soma. Biocytin is shown in green. Scale bar, 20 μm. C, Mean ± SE of EPSP slope from five cells identified as dendrite-targeting CA1 interneurons expressing CB1R. None of the cells showed significant lasting plasticity in the EPSP. Top, Consecutive EPSPs in the two pathways during baseline and 20 min after HFS. D, Visualization of a CB1R+ non-basket cell (k270582, reconstruction from two 70-μm-thick sections), recorded in perforated and whole-cell mode. Axon ramifies in strata oriens and radiatum but not in pyramidale. It was verified that the main axon originated 55 μm away from the soma at a point at which the dendrite turned by 90° degrees. Scale bar, 100 μm. Fluorescence micrographs demonstrating immunopositivity for CB1R in an axon visualized with biocytin (green, indicated by arrow; structured illumination microscopic images). Scale bar, 20 μm. E, Another example of a non-basket cell (k170471, dendrites in red, from three 70-μm-thick sections, axon in blue, from two sections) recorded in whole-cell mode that was also confirmed to be positive for CB1R (data not shown) (but see supplemental Table 2, available at www.jneurosci.org as supplemental material). Note the rich axon arborization in strata radiatum and oriens but the clear absence of axon concentration in str. pyramidale. Scale bar,100 μm. F, Comparison of baseline-normalized EPSP slopes after HFS (20 min) in the two types of dendrite-targeting interneurons. Filled and open symbols indicate tetanized and control pathways, respectively (***p < 0.005, unpaired t test). SL-M, str. lacunosum moleculare; SR, str. radiatum; SP, str. pyramidale; SO, str. oriens.
Figure 3.
Figure 3.
CB1R+ basket cells and non-basket cells with intact NMDAR-mediated transmission fail to show long-term plasticity. A, Schematic shows HFS protocol; tetanic stimulation (stim.) to one pathway is paired with depolarization of postsynaptic cell to 0 mV in current clamp (Ic). NMDARs are not blocked. Histogram shows that intense firing of postsynaptic action potentials (APs) was associated with presynaptic stimuli. B, Mean ± SE of EPSP slope from four cells recorded in perforated patch and identified post hoc as CB1R+ basket cells. None of the cells showed significant lasting plasticity in the EPSP. Top, EPSPs in the two pathways during baseline and 10 min after HFS. C, Schematic shows TBS stimulation protocol; trains of stimuli (100 Hz, five pulses) are delivered to one pathway at 5 Hz, while postsynaptic cell is at resting membrane potential (action potentials truncated). Histogram shows number of postsynaptic action potentials elicited by presynaptic stimuli. D, Perforated patch recording from four CB1R+ basket cells showed EPSPs without lasting plasticity. EPSP slope in theta-bursted pathway was not different from baseline or from control pathway 15 min after the TBS. Top, Consecutive EPSP traces from one experiment. E, Similar recordings show lack of long-term plasticity of EPSPs in CB1R+ non-basket cells (n = 6). Cells were repatched and identified as above. Top, EPSPs from an individual experiment. F, Baseline-normalized average EPSPs in the three types of experiments shown above. Filled symbols indicate HFS- or TBS-treated pathway, and open symbols show the control pathway. Data are taken 10–15 min after the HFS or TBS.
Figure 4.
Figure 4.
PV+ interneurons are excited via CP-AMPARs and CB1R-expressing interneurons via calcium-impermeable AMPARs in the CA1 area. A, I–V relations of AMPAR-mediated EPSCs are interneuron type specific. PV+ basket cells and axo-axonic cells have highly inward rectifying EPSCs, which is a hallmark of CP-AMPARs. In contrast, EPSCs in CB1R+ basket cells show more linear current–voltage relation. EPSCs were evoked by stimulation in str. oriens/alveus. Mean ± SE of normalized I–V relationship in the three perisomatic-targeting cell types illustrated in colors (green for axo-axonic, blue for PV+ basket cells, and red for CB1R+ basket cells). Right, EPSCs at +60 and −60 mV in three different cells (color coding indicates cell type as above). WhC, Whole-cell mode. B, Histograms showing EPSC RIs in the five different interneuron types. RIs in PV+ interneuron types (AAC, PV+ BC, Bistr PV+) are on average 0.11, whereas in CB1R-expressing interneurons (BC CB1R+ and non-BC CB1R+) RIs are on average 0.75. Color coding of perisomatic-targeting interneuron types is as in A. C, CP-AMPAR blocker PhTx blocks excitatory input to PV+ interneuron types (filled symbols) but has a small effect on EPSCs in CB1R+ cells (n = 11, p > 0.05; open symbols). Data show mean ± SE, and a horizontal bar indicates timing of PhTx wash-in. PV+ cells include three basket, three axo-axonic, and three bistratified cells. CB1R+ cells are basket cells. Significance level indicates difference from baseline (***p < 0.005, paired t test). D, Averaged EPSCs in one CB1R-expressing basket cell and in an axo-axonic cell during baseline and after wash-in of PhTx (20 min).
Figure 5.
Figure 5.
Disynaptic GABAergic transmission in the CA1 involves activation of interneurons with CP-AMPARs. CP-AMPAR blocker PhTx (10 μm) strongly inhibits disynaptic IPSCs recorded in the pyramidal cell soma. The effect of PhTx was studied at three different IPSC amplitudes relative to the maximum (maximum, 75%, and 30% amplitudes) and was most pronounced at lower amplitudes of disynaptic IPSCs, indicating strong contribution of interneurons with CP-AMPARs. A, Top, IPSC averages in one experiment. Symbols indicate ctrl, +PhTx, and +NBQX as below. Bottom, Histogram shows IPSC amplitudes at three different stimulus intensities relative to the maximum disynaptic IPSC. IPSCs were evoked by extracellular stimulation in oriens/alveus close to subiculum. Schematic shows experimental design. Open bars show IPSCs (mean ± SE) in control, and gray bars show IPSCs after wash-in of PhTx (15 min) (*p < 0.05, **p < 0.01, ***p < 0.005, paired t test). Disynaptic origin of IPSCs was confirmed at the end by NBQX application (10 μm, filled bars). WhC, Whole-cell mode. B, Temporal properties of blocking disynaptic IPSCs by PhTx when 30% of maximum IPSC was used throughout experiment. Horizontal bars indicate timing of drug application as indicated. Top, Consecutive IPSCs in one experiment during baseline and after exposure to the drugs.
Figure 6.
Figure 6.
LTP of disynaptic GABAergic transmission in str. oriens is NMDAR independent, pathway specific, and requires interneurons with CP-AMPARs. A, HFS induces long-term potentiation in disynaptic IPSCs recorded in CA1 pyramidal cell somata. Two disynaptic pathways were stimulated with electrodes positioned in str. oriens/alveus. Schematic shows experimental design. IPSC amplitude was adjusted to ∼30% of maximum. After a baseline, HFS was given to one of the two pathways (filled symbols), the other pathway was not tetanized and was used as a control (open symbols). LTP was observed for 25 min. Full blockade of IPSCs at the end by NBQX (wash-in indicated by horizontal bar) confirmed the disynaptic nature of the IPSCs. Data are from one cell, in the presence of dl-APV (100 μm) and CGP55845 (1 μm). In addition, cannabinoid receptors were blocked with AM-251 (10 μm). WhC, Whole-cell mode. B, Similar recordings as in A, averaged from eight cells showing mean ± SE of disynaptic IPSC amplitude. Top left, Bar histogram shows disynaptic IPSC strength relative to maximum in the pathways during baseline (mean ± SE). Top right, Averaged IPSCs at different time points in one cell as indicated. C, Comparison of averages of baseline-normalized IPSC amplitudes in all experiments 20 min after the HFS. Filled and open symbols indicate tetanized and control pathways as above (***p < 0.005, unpaired t test). D, LTP of disynaptic GABAergic transmission fails in the presence of the CP-AMPAR blocker PhTx. Similar experiment as in A but in the presence of PhTx (10 μm). E, Disynaptic IPSC mean ± SE eight experiments in the presence of PhTx as in D. Insets as in B. F, Averages of baseline-normalized IPSCs in all experiments 20 min after the HFS. G, HFS does not change monosynaptic GABAergic IPSC. Monosynaptic IPSCs measured in CA1 pyramidal cell soma elicited by stimulation from str. oriens. IPSC amplitudes were adjusted on average below 30% of maximum (inset bar histogram). HFS was applied to one pathway (filled symbols) after a baseline period. Control pathway is shown by open symbols. HFS failed to induce lasting changes in the monosynaptic IPSC. Plot shows mean ± SE of baseline-normalized IPSC amplitude in six cells. IPSCs were blocked by picrotoxin at the end. GABAB, ionotropic glutamate, and CB1Rs were blocked with CGP55845 (1 μm), NBQX (10 μm), dl-APV (100 μm), and AM-251 (10 μm). Averaged IPSCs are shown from one experiment during baseline and after HFS (20 min).

Similar articles

Cited by

References

    1. Ali AB. Presynaptic inhibition of GABAA receptor-mediated unitary IPSPs by cannabinoid receptors at synapses between CCK-positive interneurons in rat hippocampus. J Neurophysiol. 2007;98:861–869. - PubMed
    1. Alle H, Jonas P, Geiger JR. PTP and LTP at a hippocampal mossy fiber-interneuron synapse. Proc Natl Acad Sci U S A. 2001;98:14708–14713. - PMC - PubMed
    1. Asrar S, Zhou Z, Ren W, Jia Z. Ca permeable AMPA receptor induced long-term potentiation requires PI3/MAP kinases but not Ca/CaM-dependent kinase II. PLoS ONE. 2009;4:e4339. - PMC - PubMed
    1. Bartos M, Vida I, Jonas P. Synaptic mechanisms of synchronized gamma oscillations in inhibitory interneuron networks. Nat Rev Neurosci. 2007;8:45–56. - PubMed
    1. Baude A, Bleasdale C, Dalezios Y, Somogyi P, Klausberger T. Immunoreactivity for the GABAA receptor alpha1 subunit, somatostatin and Connexin36 distinguishes axoaxonic, basket, and bistratified interneurons of the rat hippocampus. Cereb Cortex. 2007;17:2094–2107. - PubMed

Publication types

MeSH terms