. 2010 Jan 27;30(4):1363-76.
doi: 10.1523/JNEUROSCI.3427-09.2010.

Acute dynamin inhibition dissects synaptic vesicle recycling pathways that drive spontaneous and evoked neurotransmission

Affiliations

Acute dynamin inhibition dissects synaptic vesicle recycling pathways that drive spontaneous and evoked neurotransmission

ChiHye Chung et al. J Neurosci. .

Abstract

Synapses maintain synchronous, asynchronous, and spontaneous forms of neurotransmission that are distinguished by their Ca(2+) dependence and time course. Despite recent advances in our understanding of the mechanisms that underlie these three forms of release, it remains unclear whether they originate from the same vesicle population or arise from distinct vesicle pools with diverse propensities for release. Here, we used a reversible inhibitor of dynamin, dynasore, to dissect the vesicle pool dynamics underlying the three forms of neurotransmitter release in hippocampal GABAergic inhibitory synapses. In dynasore, evoked synchronous release and asynchronous neurotransmission detected after activity showed marked and unrecoverable depression within seconds. In contrast, spontaneous release remained intact after intense stimulation in dynasore or during prolonged (approximately 1 h) application of dynasore at rest, suggesting that separate recycling pathways maintain evoked and spontaneous synaptic vesicle trafficking. In addition, simultaneous imaging of spectrally separable styryl dyes revealed that, in a given synapse, vesicles that recycle spontaneously and in response to activity do not mix. These findings suggest that evoked synchronous and asynchronous release originate from the same vesicle pool that recycles rapidly in a dynamin-dependent manner, whereas a distinct vesicle pool sustains spontaneous release independent of dynamin activation. This result lends additional support to the notion that synapses harbor distinct vesicle populations with divergent release properties that maintain independent forms of neurotransmission.


Figures
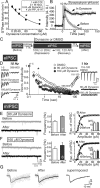
Figure 1.
Figure 1.
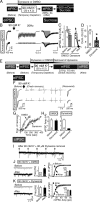
Endocytosis of synaptic vesicles during and after sustained stimulation requires GTPase activity of dynamin. A, Dynasore inhibits GTPase activity of PI(4,5)P2-stimulated dynamin 1 in vitro in a concentration-dependent manner (n = 3–4). *p < 0.05. B, Dynasore impairs endocytosis of synaptic vesicles during stimulation. The 10 Hz stimulation in the presence of 80 μm dynasore showed little decay of pHluorin signal after stimulation as well as revealed additional rise of fluorescence during stimulation, suggesting that dynasore indeed impairs endocytosis in hippocampal synapses (n = 450 synapses from 4 coverslips). A.U., Arbitrary units. C, Experimental protocol. Cells were stimulated at 10 Hz for 60 s in the presence of either 0.2% DMSO (vehicle) or indicated concentrations of dynasore. mIPSCs were measured before and after transient incubation with DMSO or dynasore in the presence of TTX. AP, Action potentials. D, After application of dynasore, synaptic responses elicited by field stimulation (eIPSCs) depressed faster during successive stimulation at 10 Hz for 1 min, leading to temporary depletion of available synaptic vesicles at terminals. In addition, dynasore at the concentrations we used (80 and 160 μm) blocked the recovery of synaptic responses after depression (1 Hz; right), *p < 0.05. E, F, Only the increase in the frequency of mIPSCs before and after 10 Hz stimulation in 80 μm dynasore was statistically significant (p < 0.05). The frequency of mIPSCs in 160 μm dynasore (p > 0.3) and the amplitude of mIPSCs in both concentrations of dynasore remained unchanged (p > 0.9). G, Averaged unitary responses before and after 80 μm dynasore application can be fully superimposed, suggesting that dynasore treatment does not alter the kinetics of individual mIPSCs.
Figure 2.
Figure 2.
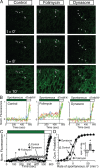
Spontaneous and evoked transmission occur at the same synapses and are differentially affected by dynasore. A, Top, Sample images of spH64 slice cultures of control (left), in 80 nm folimycin (middle), and in 80 μm dynasore (right). The white arrows point to the puncta that show markedly visible increases in fluorescence during folimycin application. Middle, Same sample images after 10 min incubation depicting the changes in fluorescence at rest presumably attributable to spontaneous release (Atasoy et al., 2008). The presence of folimycin caused a slight increase of fluorescence with a relatively constant rate over 10 min. In contrast, the presence of dynasore did not trigger a comparable change in resting fluorescence levels, suggesting that spontaneous synaptic vesicle recycling was not affected by dynamin inhibition. Bottom, Robust increase in fluorescence was observed after application of 47 mm K+ solution in all cases. B, Sample traces depict the fluorescence change at the level of individual synapses. Note that folimycin incubation (middle) alters the rate of fluorescence increase at rest and during depolarization at each selected synaptic bouton, indicating that spontaneous and evoked neurotransmission occurs at the same inhibitory synapses. C, Averaged fluorescence changes at rest and during elevated K+ application under each condition (n = 934, 890, 968 synapses from 6 slices each for control, folimycin, dynasore, respectively). Fluorescence values were normalized with respect to their highest respective levels during 47 mm K+ application. Note that fluorescence changes at rest in the presence of dynasore were not different from control (p > 0.5), whereas notable increases were detected in the presence of folimycin (*p < 0.05) suggesting that application of dynasore hardly interferes with spontaneous synaptic vesicle recycling. D, Cumulative probability histogram of the rate of spontaneous fluorescence increase in individual synapses. The inset shows the average rate of spontaneous fluorescence increase (ΔF/min) under each condition. The spontaneous fluorescence increase rate (ΔF/min) in folimycin was faster than in dynasore or in control conditions, although no significant difference was observed between control and dynasore group (*p < 0.05).
Figure 3.
Figure 3.
Extensive depletion of recycling vesicles after dynamin inhibition leaves spontaneous neurotransmission intact. A, Experimental protocol using 90 mm K+/dynasore application to deplete recycling synaptic vesicles. B, Repeated 90 mm K+/dynasore application completely suppressed subsequent evoked synaptic responses and inhibited hypertonic sucrose-induced release by 60%. C, The amplitudes of eIPSC before and after 90 mm K+ application in the presence of DMSO were not significantly different (n = 7; p > 0.1). However, eIPSC amplitudes after 90 mm K+/dynasore were decreased by 95%, suggesting that 90 mm K+/dynasore application depleted available vesicles that fuse in response to action potentials (n = 6; p < 0.001). D, The charge transfer induced by sucrose application (15 s) in the presence of dynasore was 40% of control (n = 6–10; p < 0.001), suggesting that hypertonicity mobilizes a larger vesicle pool compared with 20 Hz stimulation. E, Experimental protocol to monitor repopulation kinetics of synaptic vesicles after temporary depletion. After 90 mm K+/dynasore application, recovery of synaptic activity was monitored during 0.1 Hz stimulation in the absence of dynasore. F, Sample recordings depicting recovery of eIPSCs after 90 mm K+ stimulation (with or without dynasore). G, Recovery of synaptic responses after 90 mm K+ stimulation (with or without dynasore) is plotted as a function of time. The time courses of recovery are normalized with respect to the amplitude of final eIPSC after 10 min of perfusion. H, Bar graphs depict the amplitudes of eIPSCs before application of 90 mm K+ with either DMSO or dynasore and after 10 min wash of 90 mm K+/DMSO or 90 mm K+/dynasore. I, A sample recording after temporary depletion induced by two executive applications of 90 mm K+ in the presence of dynasore. Arrows indicate the time points when stimulations were applied. Note that, under these conditions, spontaneous neurotransmission remains intact, whereas eIPSCs are abolished. J, K, The levels of sIPSCs (spontaneous transmission measured in the absence of TTX) before and after application of 90 mm K+/0.2% DMSO or 90 mm K+/80 μm dynasore were analyzed. The frequency of sIPSCs was not decreased after 90 mm K+/dynasore (n = 6; p > 0.9), suggesting differential regulation of synaptic vesicles for action potential-driven release and spontaneous release (n = 3–6). The amplitude of sIPSCs was not altered (n = 6; p > 0.6). Challenge with 90 mm K+ with DMSO increased the frequency (n = 3; p < 0.01) but not the amplitude (n = 3; p > 0.6) of sIPSCs. *p < 0.05.
Figure 4.
Figure 4.
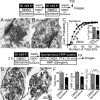
Incubation with dynasore during stimulation causes vesicle depletion. A–C, Before fixation and visualization, cells were challenged with 90 mm K+ solution (2× for 30 s each) in the presence of either 0.1% DMSO or 80 μm dynasore. A, B, Representative electron micrographs of synaptic terminals after 90 mm K+/DMSO or 90 mm K+/dynasore. C, Application of 90 mm K+/dynasore solution decreased the number of total synaptic vesicles (Total SVs) (p < 0.001). D–F, Cells were incubated with HRP (25 mg/ml) for 15 min in the presence of TTX after depletion protocol to assess the degree of spontaneous synaptic vesicle trafficking. D, E, Representative electron micrographs of synaptic terminals. White arrows indicate synaptic vesicles that took up HRP under resting conditions after 90 mm K+/dynasore-induced depletion. F, The 90 mm K+/dynasore-induced depletion decreased the number of the total synaptic vesicles (p < 0.001). The number of HRP-positive synaptic vesicles was slightly decreased in the dynasore group (p < 0.01). However, the relative number of HRP-positive synaptic vesicles per synapse remains unchanged (p > 0.6). *p < 0.05.
Figure 5.
Figure 5.
Dynamin dependence of asynchronous neurotransmitter release. A, Experimental protocol. Cells were stimulated at a frequency of 10 Hz for 50 action potentials. Then, after 2-min-long application of dynasore (or DMSO control), cells were stimulated twice in 1 min intervals. B, Sample recordings in 8 mm Ca2+ before dynasore application and two rounds of stimulation in the presence of 8 mm Ca2+ and dynasore. C, Brief application of dynasore does not affect the initial eIPSC amplitude in 8 mm Ca2+ (n = 7–13; p > 0.8). However, subsequent stimulation caused a decrease in the initial eIPSC amplitudes in the presence of dynasore but not under control conditions (in DMSO). The amplitude of the initial eIPSC in a second round of stimulation in DMSO was 0.92 ± 0.02% of the first round, whereas in dynasore the initial eIPSC in the second round was 0.55 ± 0.06% (n = 6–7; p < 0.001) of the first round. *p < 0.05. D, Total asynchronous release was quantified as the area from the onset of final stimulation to the baseline (Qasync release, gray area). Qasync release was decreased in the presence of dynasore (n = 7; p < 0.001) but not in DMSO (n = 6, p > 0.5). First, Qasync release in dynasore was not different from in 8 mm Ca2+ before dynasore application (p > 0.4). *p < 0.05. E, Decay phase of the last (50th) eIPSC was normalized and fitted with a single-exponential function to extract the time constant τdecay. τdecay of the 50th eIPSC before dynasore application was 1242 ± 420 ms, and after dynasore application, it was reduced to 237 ± 38 ms (n = 7; p < 0.05 between the dotted time line). τdecay of single eIPSCs were measured as 78 ± 7 ms.
Figure 6.
Figure 6.
Prolonged dynasore application failed to suppress spontaneous neurotransmission. A, Experimental protocol. mIPSC was measured up to 1 h in the presence of 80 μm dynasore. B, Sample traces at different time points in the presence of 80 μm dynasore. C, Plot depicts the number of mIPSCs detected per 30 s period during 1-h-long recordings. D, The amplitude of mIPSCs show an increasing trend that did not reach significance (p = 0.056; n = 6). E, Comparison of the amplitudes of eIPSCs detected before and after 1 h incubation in 80 μm (n = 4). The 1 h incubation in dynasore at rest left 40% of eIPSCs intact. The decay time constant of eIPSCs before and after prolonged dynasore application were not altered (n = 4; p > 0.4).
Figure 7.
Figure 7.
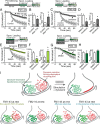
Properties of spontaneous synaptic vesicle trafficking reported by FM2-10 and FM1-43 diverge. The top outlines the experimental paradigm used to label vesicles that recycle spontaneously or in response to activity. A, When FM2-10 was used to label vesicle at rest or during depolarization, the kinetics of subsequent dye loss during 90 mm K+ stimulation was different depending on the loading protocol. Vesicles labeled with spontaneous dye uptake were refractory to 90 mm K+ stimulation, leading to slow release kinetics. B, In contrast, uptake of FM1-43 at rest or in response to stimulation resulted in fast dye loss regardless of the mode of dye uptake. C, Bar graph depicts the average time constants of dye loss after FM2-10 uptake during activity and at rest (n = 3, 520 synapses for both conditions; p < 0.01). *p < 0.05. D, Bar graph depicts the average time constants of dye loss after FM1-43 uptake during activity and at rest (n = 11, 1760 synapses for both conditions; p > 0.2). E, The fraction of vesicles that take up FM1-43 spontaneously is larger than those labeled by FM2-10 at rest with respect to maximal dye uptake induced by 47 mm K+ stimulation [ΔF (Spontaneous loading protocol)/ΔF (47 mm K+)] (*p < 0.05).
Figure 8.
Figure 8.
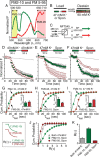
Simultaneous monitoring of FM2-10 and FM5-95 release shows that spontaneously trafficking vesicles are refractory to activity. A, Emission spectra of FM2-10 and FM5-95 during 488 and 543 nm excitation. B, Experimental paradigm depicting dual-color confocal experiments with FM2-10 and FM5-95. C, Illustration of confocal configuration for dual-color experiments. Samples were excited at both 488 and 543 nm. For green signals, the emission passed through the bandpass (BP) filter 500–530 nm was collected. For red signals, the fluorescence emission between 650 and 710 nm was collected. D–F, The graphs depict the average FM dye destaining kinetics from all experiments (n = 3–4, 330–470 synapses under each condition). The dye loading condition for each panel is illustrated at the top. FM2-10 and FM5-95 behave in a very similar manner when loaded during depolarization, presumably attributable to their similar hydrophobicities (stemming from the lengths of their hydrocarbon tails). After spontaneous uptake, however, FM2-10 and FM5-95 exhibited slower dye loss in response to depolarization (FM2-10 in E and FM5-95 in F). G–I, Analysis of the fast time constants of destaining (τfast) for FM2-10 and FM5-95 at a individual synapses. G, When both dyes were used for activity-dependent labeling, τfast of FM2-10 and of FM5-95 was comparable (330 synapses from 3 experiments; p > 0.6) as well as the total amount of dye uptake (ΔF), and the fraction labeled spontaneously [ΔF(%)] (p > 0.2). H, When FM2-10 was used for spontaneous labeling, τfast of FM2-10 was slower than that of FM5-95 (320 synapses from 4 experiments; p < 0.05). I, When FM5-95 was used for spontaneous labeling, τfast of FM5-95 was slower than that of FM2-10 (340 synapses from 4 experiments; p < 0.01). J, K, Analysis of the ratio of τfast [R(τ)] measurements at individual synapses. R(τ) was defined as τfast (FM2-10)/τfast (FM5-95). The distribution as well as the mean R(τ) values were different depending on the manner in which dyes were taken up (p < 0.001).
Figure 9.
Figure 9.
FM1-43-labeled synaptic vesicles at rest reflects the history of activity in a given set of synapses. A, B, Inhibition of neuronal network activity for 30 min in TTX reduced the extent of FM1-43 uptake at rest (p < 0.05) and slowed the rate of subsequent dye loss during depolarization (p < 0.05; 1025 synapses from 6 experiments for control, and 950 synapses from 5 experiments for TTX-treated group) *p < 0.05. C, D, In immature synapses (10–12 DIV), FM1-43 labeled a smaller pool of synaptic vesicles at rest that were mobilized with a relatively slow rate during 90 mm K+ application (p < 0.001; 1025 mature synapses from 6 experiments, 420 immature synapses from 5 experiments). *p < 0.05. E, F, The presence of 80 μm dynasore caused a significant decrease in the extent of spontaneous FM1-43 uptake at rest (p < 0.001) and decreased the τfast of dye destaining significantly (p < 0.05; 490 synapses from 6 experiments for DMSO, 1000 synapses from 11 experiments for dynasore). *p < 0.05. G, H, However, in the case of FM2-10, dynasore application failed to alter the extent of spontaneous dye uptake or subsequent dye mobilization (p > 0.2; 280 synapses from 3 experiments for DMSO, 550 synapses from 6 experiments for dynasore). I, Top, The diagram depicts two synaptic vesicle pools that coexist within individual synaptic boutons and selectively maintain spontaneous or evoked neurotransmission in parallel. Activity-dependent stimulation in the presence of dynasore leads to depletion of activity-dependent recycling pool but leaves spontaneous recycling intact. Bottom, Under resting conditions that follow activity spontaneous uptake and release of FM2-10 is a selective reporter for genuine spontaneous synaptic vesicle trafficking, which in turn gives rise to spontaneous neurotransmission. FM1-43, conversely, labels two endocytic processes: one that overlaps with spontaneous synaptic vesicle trafficking, and the other an asynchronous form of endocytosis that follows strong bouts of activity with a delay and requires dynamin function. After long periods of rest, this asynchronous endocytosis ceases and FM2-10 as well as FM1-43 labels the same spontaneously recycling pool. Vesicle recycling via this asynchronous form of endocytosis can also be inhibited by dynasore.

Comment in

References

    1. Achiriloaie M, Barylko B, Albanesi JP. Essential role of the dynamin pleckstrin homology domain in receptor-mediated endocytosis. Mol Cell Biol. 1999;19:1410–1415. - PMC - PubMed
    1. Atasoy D, Ertunc M, Moulder KL, Blackwell J, Chung C, Su J, Kavalali ET. Spontaneous and evoked glutamate release activates two populations of NMDA receptors with limited overlap. J Neurosci. 2008;28:10151–10166. - PMC - PubMed
    1. Barylko B, Binns D, Lin KM, Atkinson MA, Jameson DM, Yin HL, Albanesi JP. Synergistic activation of dynamin GTPase by Grb2 and phosphoinositides. J Biol Chem. 1998;273:3791–3797. - PubMed
    1. Cremona O, De Camilli P. Synaptic vesicle endocytosis. Curr Opin Neurobiol. 1997;7:323–330. - PubMed
    1. Delgado R, Maureira C, Oliva C, Kidokoro Y, Labarca P. Size of vesicle pools, rates of mobilization, and recycling at neuromuscular synapses of a Drosophila mutant, shibire. Neuron. 2000;28:941–953. - PubMed

Publication types

MeSH terms