. 2010 Jan 27;30(4):1441-51.
doi: 10.1523/JNEUROSCI.3244-09.2010.

Quantal analysis reveals a functional correlation between presynaptic and postsynaptic efficacy in excitatory connections from rat neocortex

Affiliations

Quantal analysis reveals a functional correlation between presynaptic and postsynaptic efficacy in excitatory connections from rat neocortex

Neil R Hardingham et al. J Neurosci. .

Abstract

At many central synapses, the presynaptic bouton and postsynaptic density are structurally correlated. However, it is unknown whether this correlation extends to the functional properties of the synapses. To investigate this, we made recordings from synaptically coupled pairs of pyramidal neurons in rat visual cortex. The mean peak amplitude of EPSPs recorded from pairs of L2/3 neurons ranged between 40 microV and 2.9 mV. EPSP rise times were consistent with the majority of the synapses being located on basal dendrites; this was confirmed by full anatomical reconstructions of a subset of connected pairs. Over a third of the connections could be described using a quantal model that assumed simple binomial statistics. Release probability (P(r)) and quantal size (Q), as measured at the somatic recording site, showed considerable heterogeneity between connections. However, across the population of connections, values of P(r) and Q for individual connections were positively correlated with one another. This correlation also held for inputs to layer 5 pyramidal neurons from both layer 2/3 and neighboring layer 5 pyramidal neurons, suggesting that during development of cortical connections presynaptic and postsynaptic strengths are dependently scaled. For 2/3 to 2/3 connections, mean EPSP amplitude was correlated with both Q and P(r) values but uncorrelated with N, the number of functional release sites mediating the connection. The efficacy of a cortical connection is thus set by coordinated presynaptic and postsynaptic strength.


Figures

Figure 1.
Figure 1.
Recordings from synaptically connected pyramidal neurons in the cortex. a, Photomicrograph of a pair of L2/3 pyramidal neurons that were synaptically connected (see b). The neurons were filled with 0.5% biocytin during recording, and the tissue was subsequently processed by conventional methods to enable visualization of recorded neurons. b, Recordings made from the pair of neurons shown in a. Raw trace of a single action potential that was evoked in the presynaptic neuron by short pulse current injection (bottom) and the averaged postsynaptic EPSP recorded in the postsynaptic neuron (top). c, Photomicrograph of a layer 2/3 pyramidal neuron (presynaptic) that is synaptically connected to a layer 5 pyramidal neuron (postsynaptic), filled with 0.5% biocytin, visualized by conventional methods. d, Mean EPSP waveform recorded in a layer 5 neuron (c) evoked by an action potential generated in a presynaptic (L2/3) neuron. e, Photomicrograph of a pair of L5 pyramidal neurons that are synaptically connected, filled with 0.5% biocytin, and visualized by conventional methods. f, Mean EPSP waveform recorded in a postsynaptic L5 neuron evoked by an action potential generated in another L5 neuron.
Figure 2.
Figure 2.
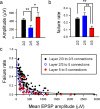
Amplitude and reliability of EPSPs recorded in layer 2/3 and layer 5 pyramidal neurons. Comparisons of mean amplitudes (a) and mean failure rates (b) for populations of L2/3 to L2/3 connections (black), L2/3 to L5 connections (blue), and L5 to L5 connections (red). *p < 0.05, **p < 0.01, for paired comparisons. c, A scatter plot of mean EPSP amplitude plotted against transmission failure rate shows a similar correlation for L2/3 connections (black circles and hyperbolic fit line; r2 = 0.62, p < 0.001) to L2/3 inputs to L5 cells (blue/white circles and blue hyperbolic fit line; r2 = 0.85, p < 0.001) and L5 to L5 connections (red circles and hyperbolic fit line; r2 = 0.40, p < 0.01).
Figure 3.
Figure 3.
Rise time as an indicator of dendritic location of EPSP. Distribution of experimental 10–90% EPSP rise times for recordings made from pairs of L2/3 pyramidal neurons (a), L2/3 to L5 pairs (b, top), and L5 to L5 connections (b, bottom) at room temperature. The effect of dendritic location on somatic EPSP amplitude and rise time was investigated using a representative L2/3 (c) and L5 (d) model neuron. Simulated EPSPs were generated using a brief injection of charge (0.1 pC) into every 50th spine across the entire dendritic arbor of the model neurons.
Figure 4.
Figure 4.
Quantal analysis of layer 2/3 to layer 2/3 connections. a, Amplitude frequency histogram of a putative single release site connection, best-fit model (N = 1, Q = 519 μV, Pr = 0.86); inset, overlaid EPSP raw traces with direct current offset subtracted. b, Amplitude frequency histogram of a multi-release site connection, best-fit model (N = 3, Q = 375 μV, Pr = 0.74); inset, overlaid EPSP raw traces with direct current offset subtracted, drawn to same scale as a. Mean values of quantal amplitude for putative single release site L2/3 to L2/3 connections (n = 6, Q = 344 μV) and multi-release site L2/3 to L2/3 connections (n = 44, Q = 282 μV) were not different (comparison by paired t test, p > 0.05, not significant). Two of five L2/3 to L5 connections were single release site connections, as were one of the seven L5 to L5 connections.
Figure 5.
Figure 5.
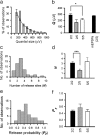
Synaptic parameters derived from quantal analysis. a, The distribution of quantal amplitudes derived from model fits (bars; mean amplitude of 289 ± 151 μV) is consistent (p > 0.05) with the relative distribution of mEPSP amplitudes from a population of four L2/3 neurons (lines with error bars; 500 recorded from each neuron, mean amplitude of 275 ± 163 μV). b, Mean values of quantal size for L2/3 to L2/3 connections (black), L2/3 to L5 connections (gray), and L5 to L5 connections (white). The black bar on the right is the mean amplitude of mEPSPs recorded from L2/3 neurons. c, The distribution of functional release sites (N) for L2/3 connections (mean of 3.1 ± 1.6). d, Mean values of N (number of functional release sites) for L2/3 to L2/3 connections (black), layer L2/3 to L5 connections (gray), and L5 to L5 connections (white). e, The distribution of Pr for L2/3 connections (mean of 0.47 ± 0.20). f, Mean values of Pr for L2/3 to L2/3 connections (black), L2/3 to L5 connections (gray), and L5 to L5 connections (white). *p < 0.05, ***p < 0.001 for paired comparisons.
Figure 6.
Figure 6.
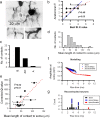
Number of functional release sites for L2/3 to L2/3 connections correlates with number of putative anatomical contacts. a, A photomicrograph showing the two points of contact (circled) between the presynaptic axon and postsynaptic dendrite of a synaptically connected pair of L2/3 neurons. The two inset boxes show the contact sites at higher magnification (at slightly different focal planes to the main image). b, Model fit values of N correlate with the number of anatomical contact points between presynaptic axons and postsynaptic dendrites (linear regression is red dotted line; r2 = 0.48, p < 0.05). Confidence limits for model fits of N overlap anatomical N values in the majority of cases (on the blue unity line), whereas five of the nine points were exact matches between functional N and anatomical N. Note that there are two points on the graph at coordinates (2,2). One is a black symbol, and the other one is gray (slightly offset from black). c, The distribution of contact sites for the 13 reconstructed pairs of neurons are primarily on basal dendrites (B; 23) and apical obliques (AO; 10), with only one contact site (1) on the main apical dendrite (A). d, Putative synaptic contact points are mostly proximal to the soma at a mean distance of 62 ± 38 μm. e, Mean distance of synaptic contacts from the postsynaptic soma for a connection (bars represent ranges) is correlated with corrected (synaptic) Q value (r2 = 0.62, p < 0.01); distance was not correlated with uncorrected (somatic) Q value (data not shown; r2 = 0.24, p > 0.05). For derivation of corrected Q values, see supplemental Figure 6 (available at www.jneurosci.org as supplemental material). The mean EPSP rise time for each connected pair of neurons that was subsequently anatomically reconstructed, color coded by the dendritic location of putative synaptic contacts, is shown in g. Four connections had putative contacts on both basal (black) and apical oblique (blue, separated by a white line) dendrites. This correlates well with modeling data (f) shown previously in Figure 3c.
Figure 7.
Figure 7.
A strong correlation between presynaptic and postsynaptic efficacy exists for both L2/3 to L2/3 connections and inputs to L5. a, Quantal size is correlated with release probability for L2/3 to L2/3 connections (r2 = 0.37, p < 0.001). The three colored points refer to the three example connections d–f. The correlation between presynaptic and postsynaptic efficacy also holds for L5 inputs (b; r2 = 0.51, p < 0.01). c, For L 2/3 to L 2/3 connections, Pr is also negatively correlated with N (r2 = 0.36, p < 0.001). The error bars in a–c are SEs. Red dotted lines in a–c represent linear fits. d–f, Representative examples of L2/3 to L2/3 connections for which we were able to fit a binomial model (illustrated in a as colored points; connection d refers to the blue circle, connection e to the pink circle, and connection f to the green circle). The strength of connection is represented by the color, with blue representing a weak connection and green representing a strong connection. Binomial model fit parameters are also listed for each connection.
Figure 8.
Figure 8.
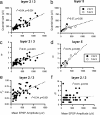
Correlation between EPSP amplitude and presynaptic/postsynaptic efficacy. Correlation between mean somatic EPSP amplitude and somatic Q for L2/3 to L2/3 connections (a; n = 50, r2 = 0.64, p < 0.001) and inputs to L5 (b; n = 12, r2 = 0.37, p < 0.05). Correlation between mean EPSP amplitude and quantal content (m), a measure of presynaptic strength, for L2/3 to L2/3 connections (c; r2 = 0.51, p < 0.001) and inputs to layer 5 (d; r2 = 0.79, p < 0.001). The correlation in c for L2/3 to L2/3 pairs can be shown to be primarily attributable to release probability being strongly correlated with mean amplitude (e; r2 = 0.34, p < 0.001) with number of release sites uncorrelated with EPSP amplitude (f; r2 = 0.01, p > 0.05). Dotted lines represent linear fits.

Similar articles

Cited by

References

    1. Alvarez FJ, Dewey DE, Harrington DA, Fyffe RE. Cell-type specific organization of glycine receptor clusters in the mammalian spinal cord. J Comp Neurol. 1997;379:150–170. - PubMed
    1. Andrasfalvy BK, Magee JC. Distance-dependent increase in AMPA receptor number in the dendrites of adult hippocampal CA1 pyramidal neurons. J Neurosci. 2001;21:9151–9159. - PMC - PubMed
    1. Atwood HL, Marin L. Ultrastructure of synapses with different transmitter-releasing characteristics on motor axon terminals of a crab, Hyas areneas. Cell Tissue Res. 1983;231:103–115. - PubMed
    1. Bannister NJ, Nelson JC, Jack JJ. Excitatory inputs to spiny cells in layers 4 and 6 of cat striate cortex. Philos Trans R Soc Lond B Biol Sci. 2002;357:1793–1808. - PMC - PubMed
    1. Bekkers JM, Stevens CF. Quantal analysis of EPSCs recorded from small numbers of synapses in hippocampal cultures. J Neurophysiol. 1995;73:1145–1156. - PubMed

Publication types

MeSH terms