

Laminar restriction of retinal ganglion cell dendrites and axons: subtype-specific developmental patterns revealed with transgenic markers
- PMID: 20107072
- PMCID: PMC2822471
- DOI: 10.1523/JNEUROSCI.4779-09.2010
Laminar restriction of retinal ganglion cell dendrites and axons: subtype-specific developmental patterns revealed with transgenic markers
Abstract
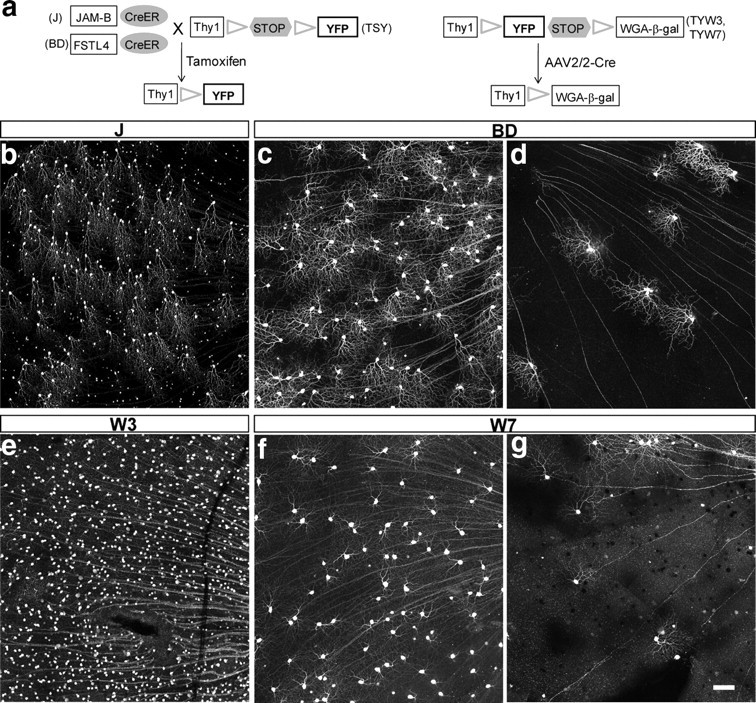
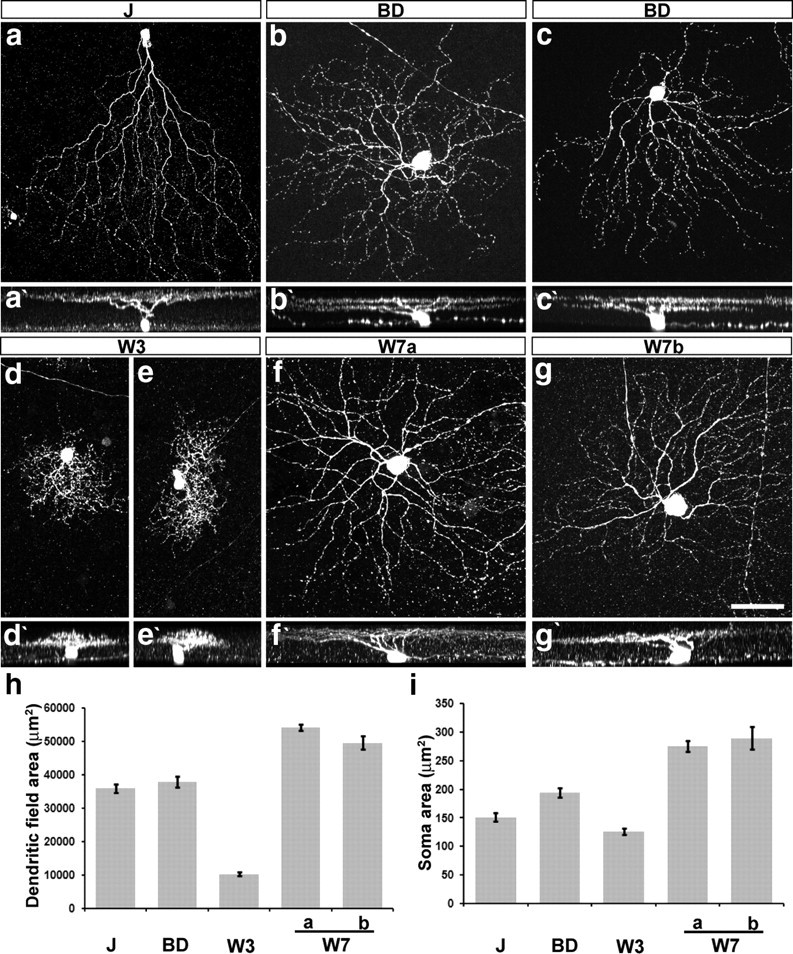
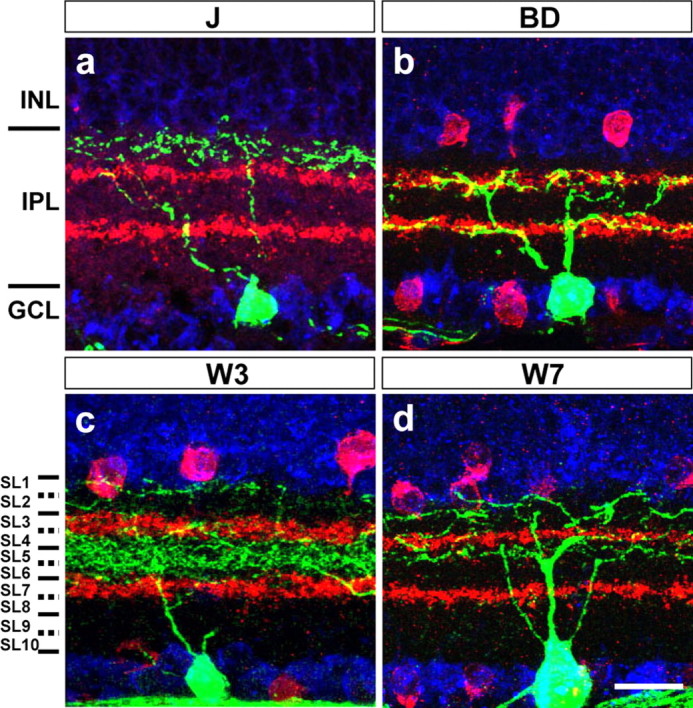
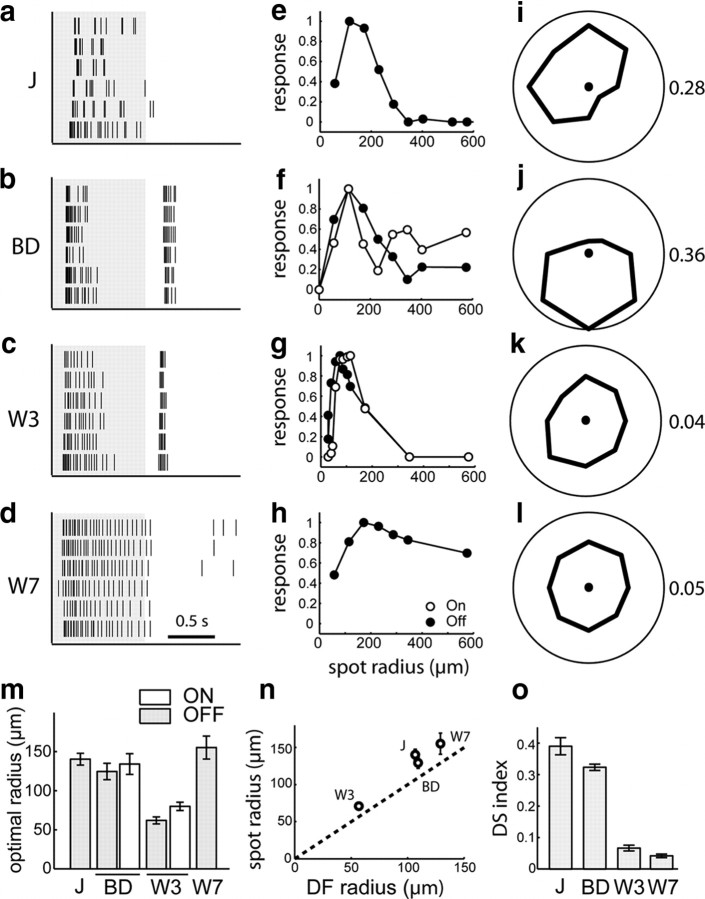
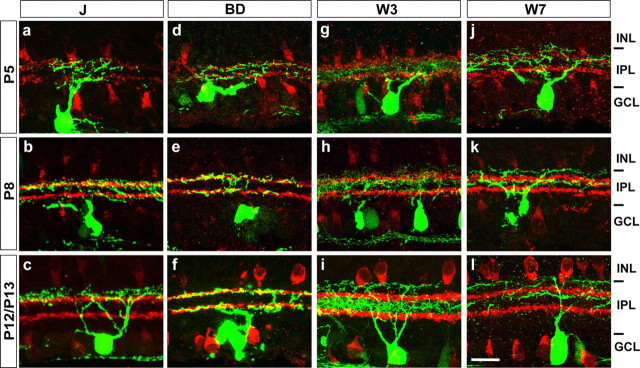
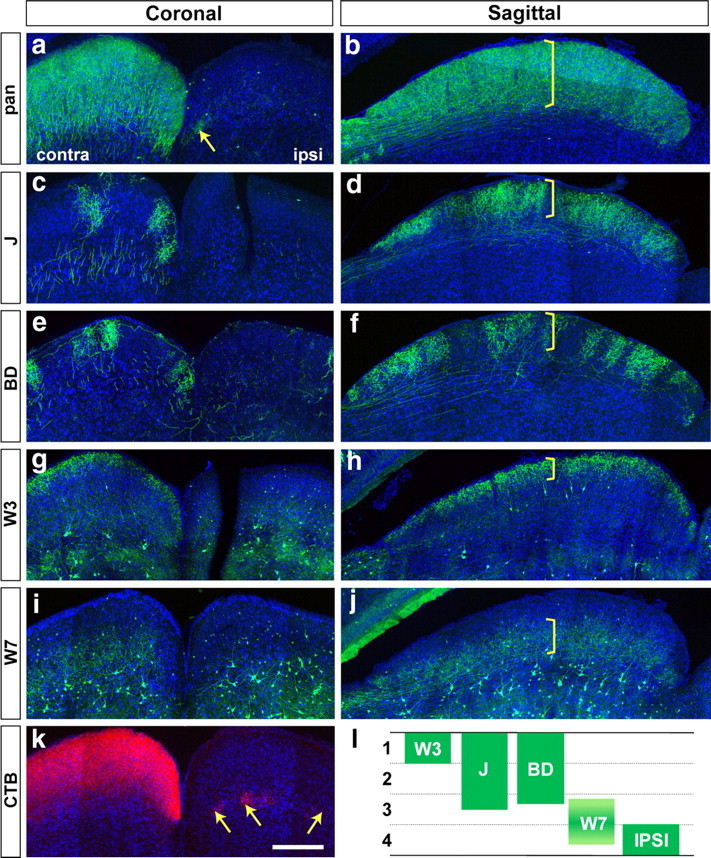
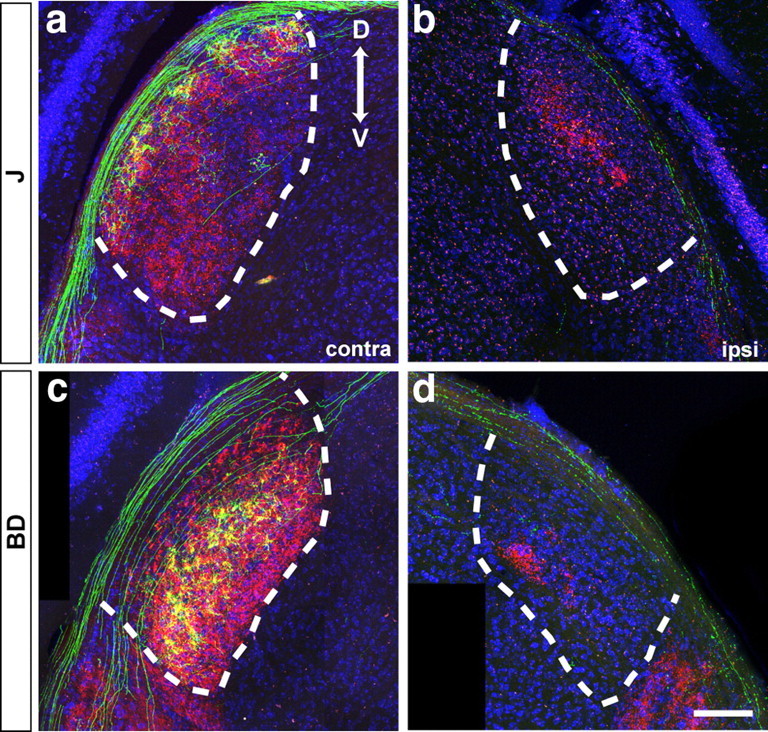
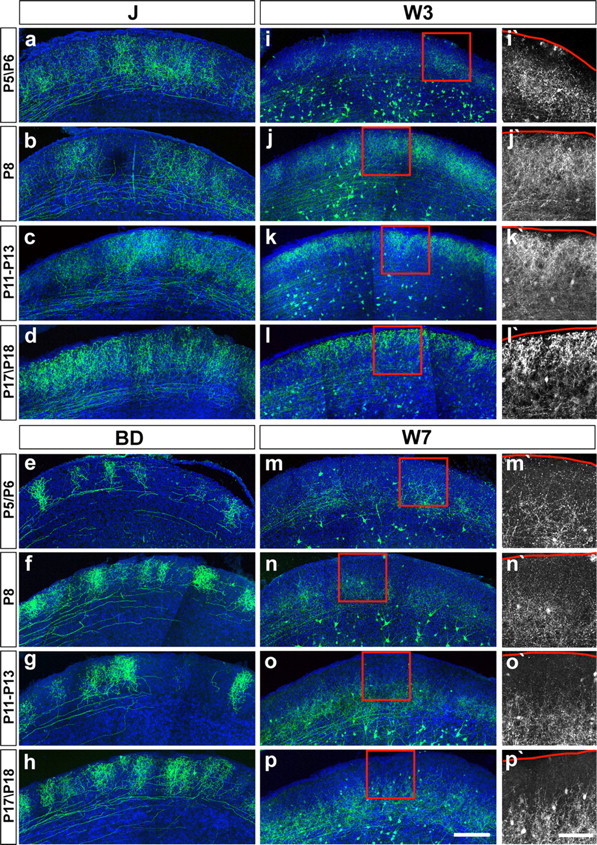
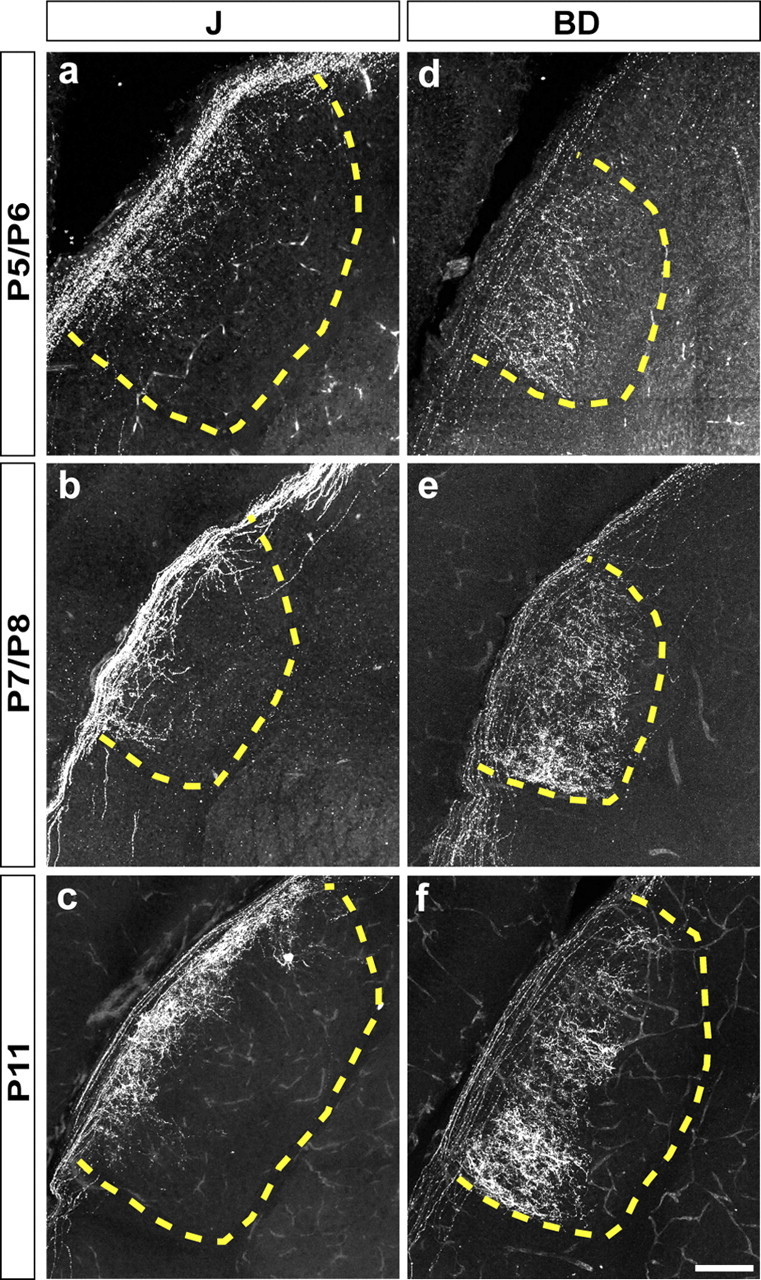
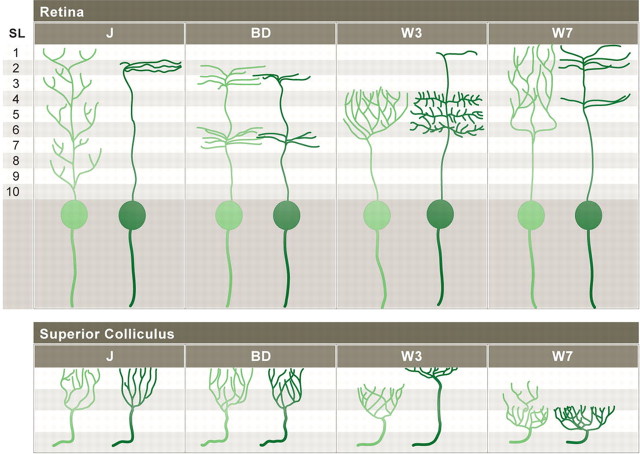
Retinal ganglion cells (RGCs), which transfer information from the eye to the brain, are heterogeneous in structure and function, but developmental studies have generally treated them as a single group. Here, we investigate the development of RGC axonal and dendritic arbors using four mouse transgenic lines in which nonoverlapping subsets of RGCs are indelibly labeled with a fluorescent protein. Each subset has a distinct functional signature, size, and morphology. Dendrites of each subset are restricted to specific sublaminae within the inner plexiform layer in adulthood, but acquire their restriction in different ways: one subset has lamina-restricted dendrites from an early postnatal stage, a second remodels an initially diffuse pattern, and two others develop stepwise. Axons of each subset arborize in discrete laminar zones within the lateral geniculate nucleus or superior colliculus, demonstrating previously unrecognized subdivisions of retinorecipient layers. As is the case for dendrites, lamina-restricted axonal projections of RGC subsets develop in different ways. For example, while axons of two RGC subsets arborize in definite zones of the superior colliculus from an early postnatal stage, axons of another subset initially occupy a deep layer, then translocate to a narrow subpial zone. Together, these results show that RGC subsets use a variety of strategies to construct lamina-restricted dendritic and axonal arbors. Taking account of these subtype-specific features will facilitate identification of the molecules and cells that regulate arbor formation.
Figures
Similar articles
-
Dendritic and axonal targeting patterns of a genetically-specified class of retinal ganglion cells that participate in image-forming circuits.Neural Dev. 2014 Feb 5;9:2. doi: 10.1186/1749-8104-9-2. Neural Dev. 2014. PMID: 24495295 Free PMC article.
-
Stereotyped axonal arbors of retinal ganglion cell subsets in the mouse superior colliculus.J Comp Neurol. 2011 Jun 15;519(9):1691-711. doi: 10.1002/cne.22595. J Comp Neurol. 2011. PMID: 21452242 Free PMC article.
-
Age-related alterations in neurons of the mouse retina.J Neurosci. 2011 Nov 2;31(44):16033-44. doi: 10.1523/JNEUROSCI.3580-11.2011. J Neurosci. 2011. PMID: 22049445 Free PMC article.
-
Pathway-specific maturation, visual deprivation, and development of retinal pathway.Neuroscientist. 2004 Aug;10(4):337-46. doi: 10.1177/1073858404265254. Neuroscientist. 2004. PMID: 15271261 Review.
-
Spontaneous patterned retinal activity and the refinement of retinal projections.Prog Neurobiol. 2005 Jul;76(4):213-35. doi: 10.1016/j.pneurobio.2005.09.002. Epub 2005 Nov 8. Prog Neurobiol. 2005. PMID: 16280194 Review.
Cited by
-
Anterior-posterior direction opponency in the superficial mouse lateral geniculate nucleus.Neuron. 2012 Nov 21;76(4):713-20. doi: 10.1016/j.neuron.2012.09.021. Neuron. 2012. PMID: 23177957 Free PMC article.
-
Subtype-specific regeneration of retinal ganglion cells following axotomy: effects of osteopontin and mTOR signaling.Neuron. 2015 Mar 18;85(6):1244-56. doi: 10.1016/j.neuron.2015.02.017. Epub 2015 Mar 5. Neuron. 2015. PMID: 25754821 Free PMC article.
-
Wiring subcortical image-forming centers: Topography, laminar targeting, and map alignment.Curr Top Dev Biol. 2021;142:283-317. doi: 10.1016/bs.ctdb.2020.10.004. Epub 2020 Nov 16. Curr Top Dev Biol. 2021. PMID: 33706920 Free PMC article. Review.
-
Trans-Seq maps a selective mammalian retinotectal synapse instructed by Nephronectin.Nat Neurosci. 2022 May;25(5):659-674. doi: 10.1038/s41593-022-01068-8. Epub 2022 May 6. Nat Neurosci. 2022. PMID: 35524141 Free PMC article.
-
Assembly and disassembly of a retinal cholinergic network.Vis Neurosci. 2012 Jan;29(1):61-71. doi: 10.1017/S0952523811000216. Epub 2011 Jul 26. Vis Neurosci. 2012. PMID: 21787461 Free PMC article. Review.
References
-
- Badea TC, Nathans J. Quantitative analysis of neuronal morphologies in the mouse retina visualized by using a genetically directed reporter. J Comp Neurol. 2004;480:331–351. - PubMed
-
- Bansal A, Singer JH, Hwang BJ, Xu W, Beaudet A, Feller MB. Mice lacking specific nicotinic acetylcholine receptor subunits exhibit dramatically altered spontaneous activity patterns and reveal a limited role for retinal waves in forming ON and OFF circuits in the inner retina. J Neurosci. 2000;20:7672–7681. - PMC - PubMed
-
- Berson DM. Retinal ganglion cell types and their central projections. In: Basbaum AI, Kaneko A, Shepherd GM, Westheimer G, editors. The senses: a comprehensive reference. Vol 1. San Diego: Academic; 2008. pp. 491–520.
-
- Bodnarenko SR, Chalupa LM. Stratification of ON and OFF ganglion cell dendrites depends on glutamate-mediated afferent activity in the developing retina. Nature. 1993;364:144–146. - PubMed
Publication types
MeSH terms
Substances
Grants and funding
LinkOut - more resources
Full Text Sources
Other Literature Sources
Molecular Biology Databases
Research Materials