. 2010 Jan 27;30(4):1523-38.
doi: 10.1523/JNEUROSCI.3861-09.2010.

The timing and location of glial cell line-derived neurotrophic factor expression determine enteric nervous system structure and function

Affiliations

The timing and location of glial cell line-derived neurotrophic factor expression determine enteric nervous system structure and function

Hongtao Wang et al. J Neurosci. .

Abstract

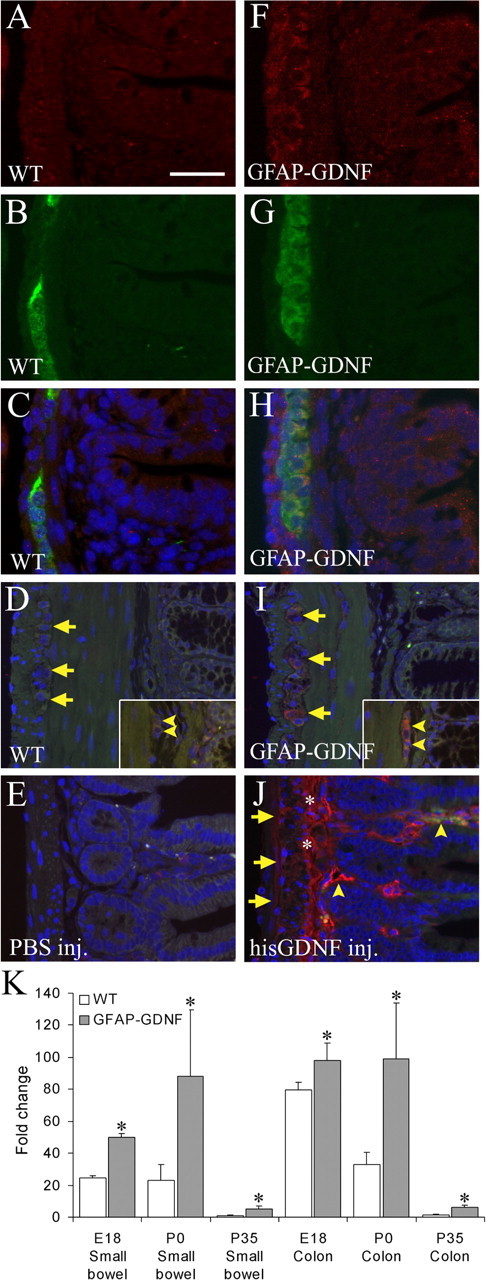
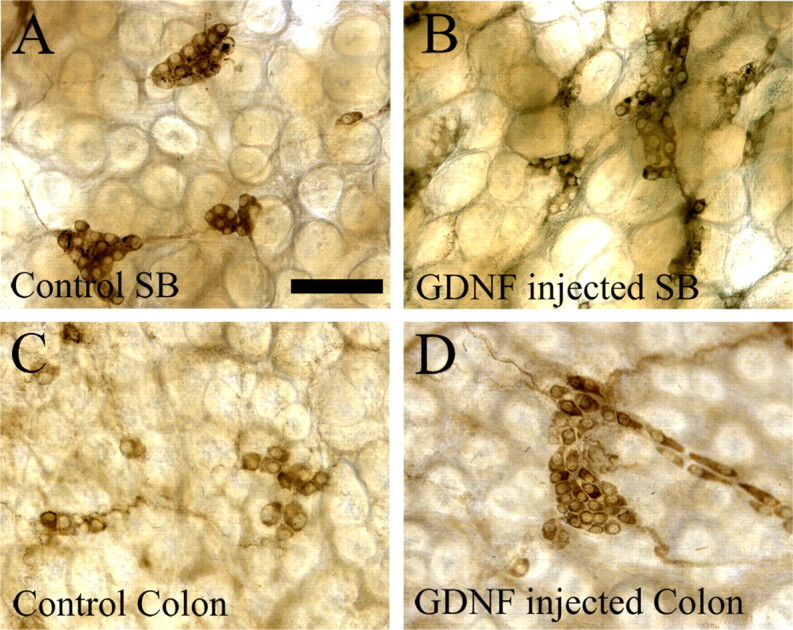
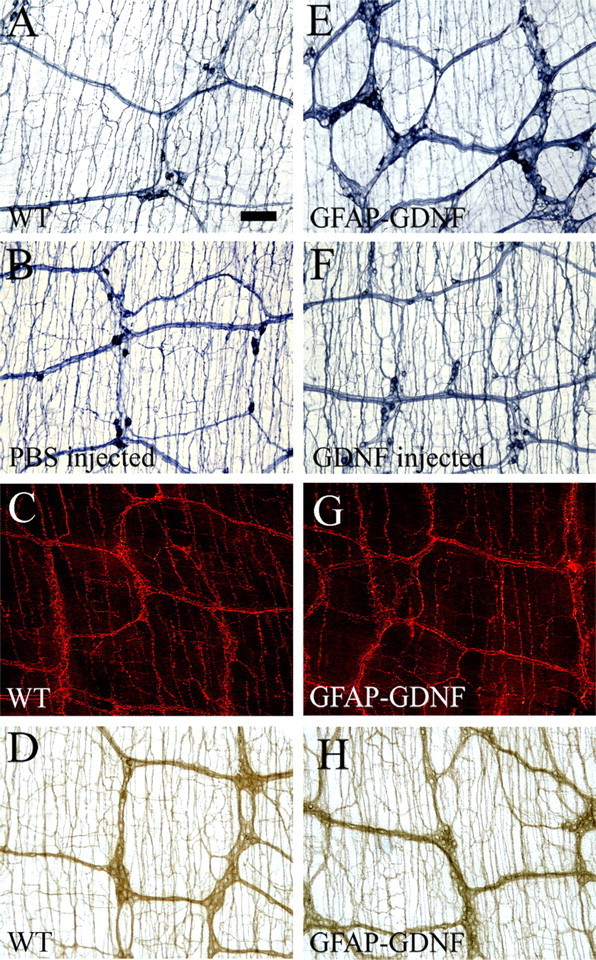
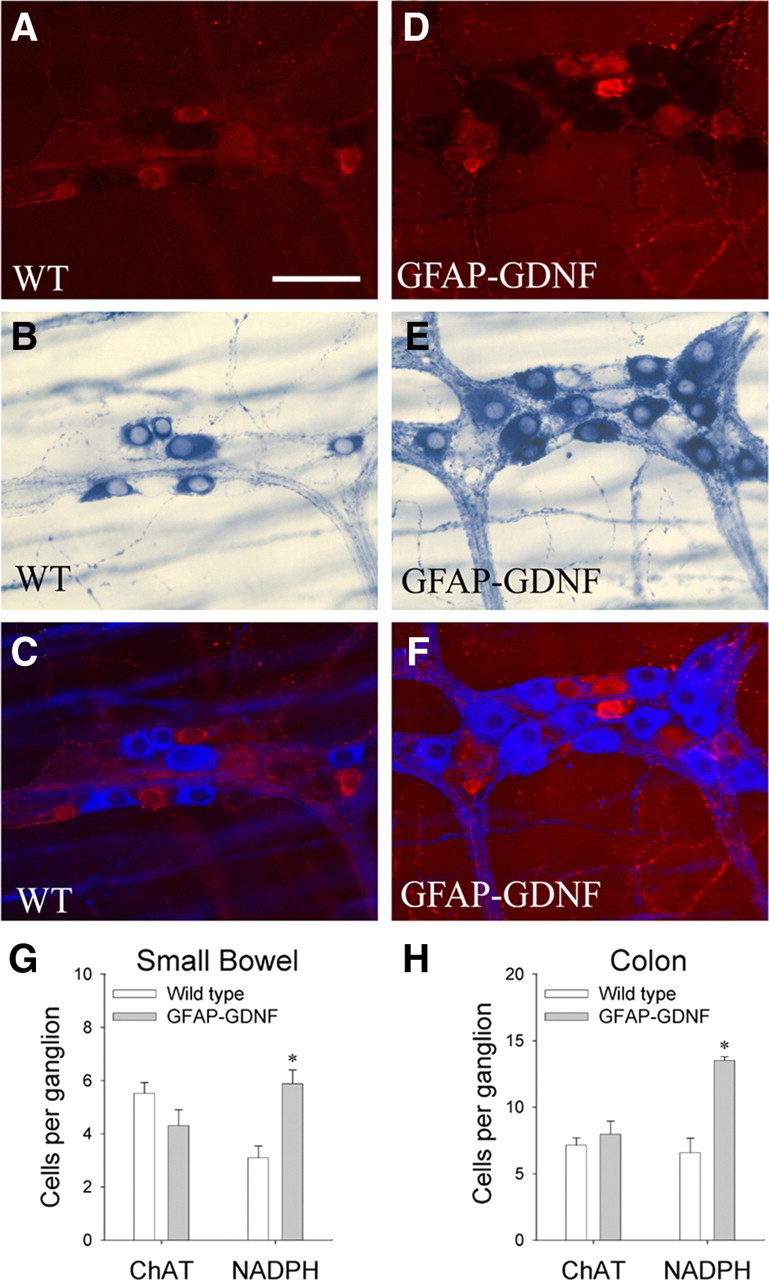
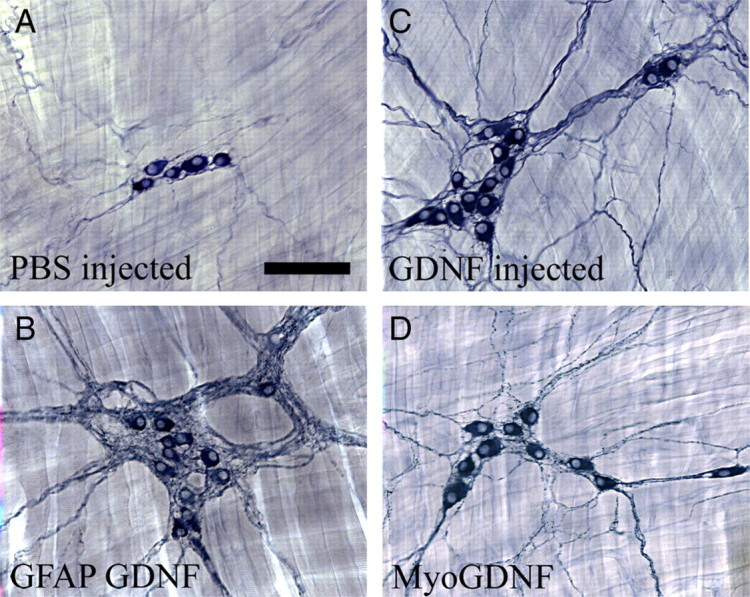
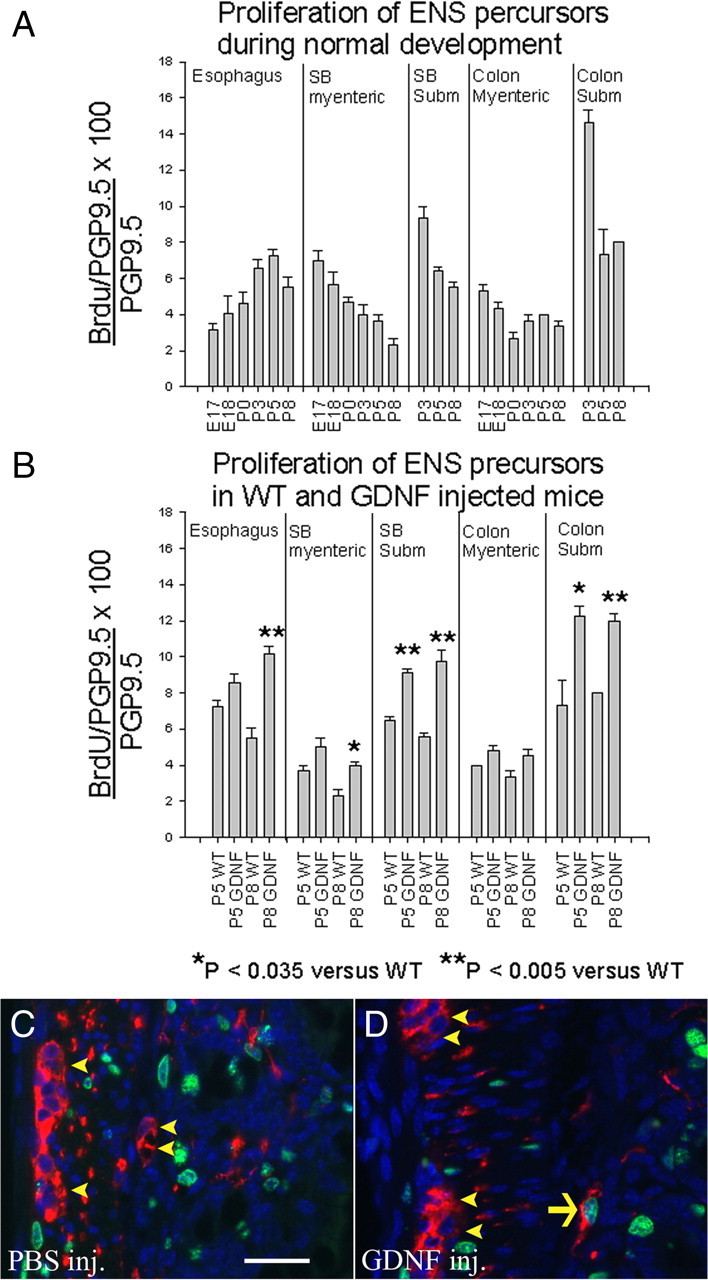
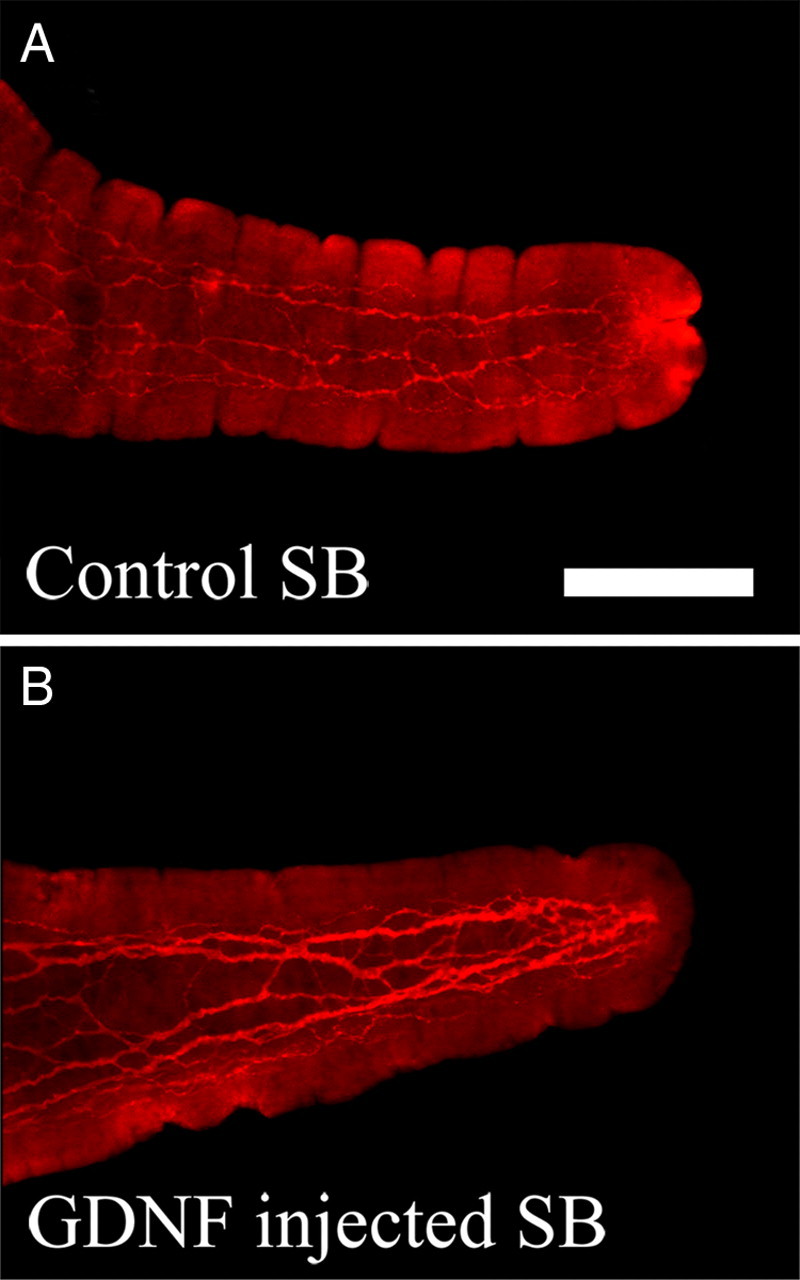
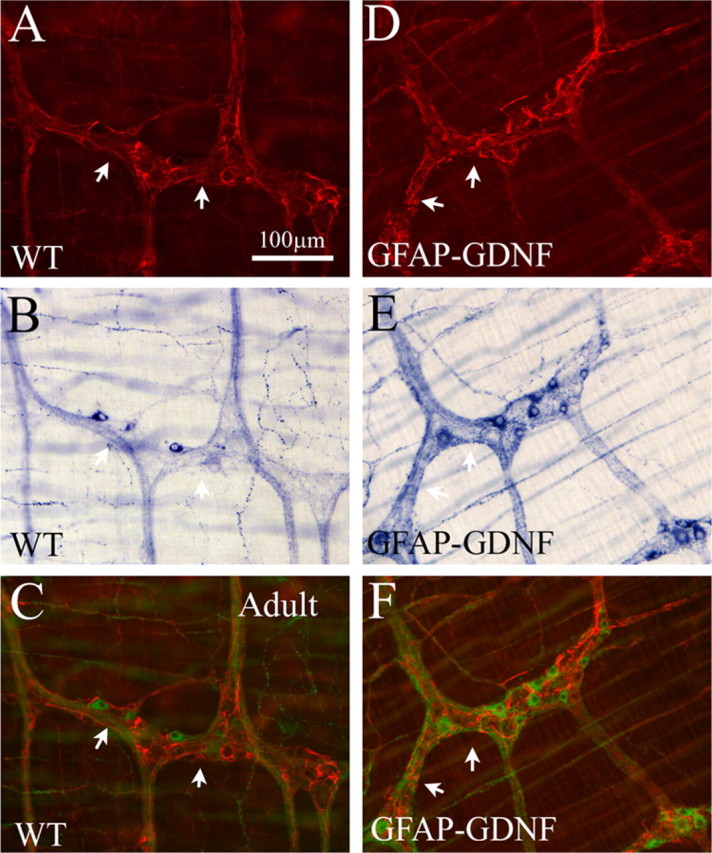
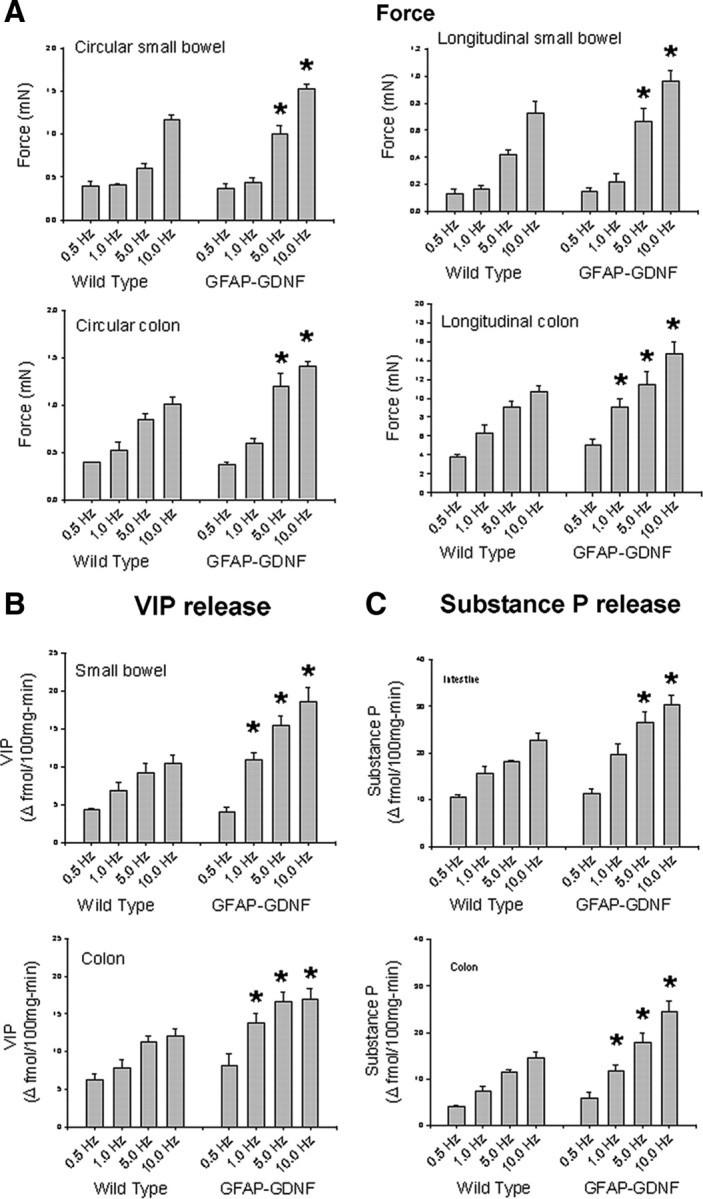
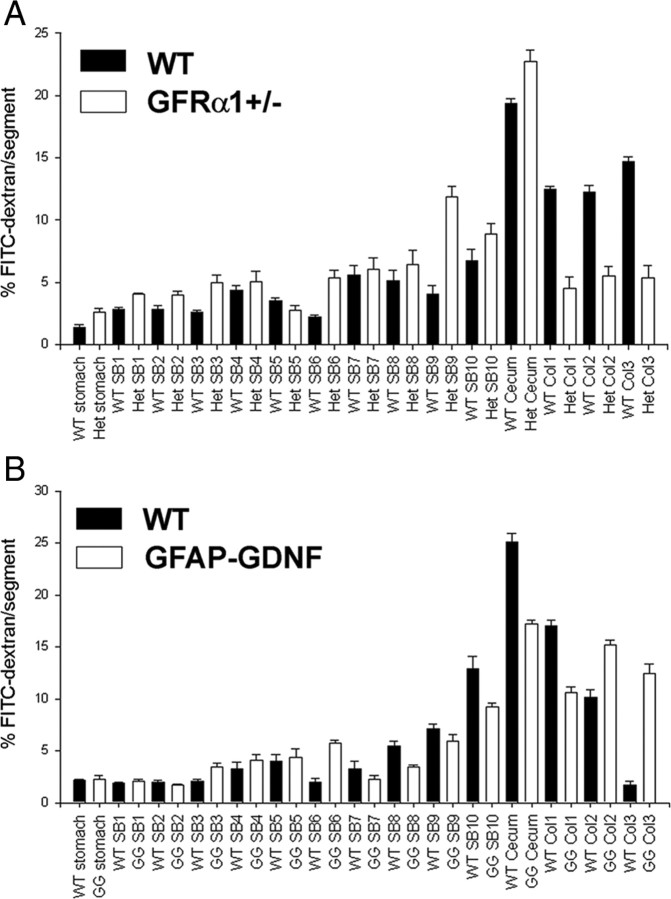
Ret signaling is critical for formation of the enteric nervous system (ENS) because Ret activation promotes ENS precursor survival, proliferation, and migration and provides trophic support for mature enteric neurons. Although these roles are well established, we now provide evidence that increasing levels of the Ret ligand glial cell line-derived neurotrophic factor (GDNF) in mice causes alterations in ENS structure and function that are critically dependent on the time and location of increased GDNF availability. This is demonstrated using two different strains of transgenic mice and by injecting newborn mice with GDNF. Furthermore, because different subclasses of ENS precursors withdraw from the cell cycle at different times during development, increases in GDNF at specific times alter the ratio of neuronal subclasses in the mature ENS. In addition, we confirm that esophageal neurons are GDNF responsive and demonstrate that the location of GDNF production influences neuronal process projection for NADPH diaphorase-expressing, but not acetylcholinesterase-, choline acetyltransferase-, or tryptophan hydroxylase-expressing, small bowel myenteric neurons. We further demonstrate that changes in GDNF availability influence intestinal function in vitro and in vivo. Thus, changes in GDNF expression can create a wide variety of alterations in ENS structure and function and may in part contribute to human motility disorders.


Figures

Figure 1.
Figure 1.
GDNF abundance is elevated near the ENS in GFAP–Gdnf and GDNF-injected mice. Immunohistochemistry for GDNF was performed on WT (A–D) and GFAP–Gdnf mouse small bowel (F–I) at E18 (A–C, F–H) and on adult colon (D, I). A, C, D, F, H, I, GDNF immunohistochemistry. B, C, G, H, PGP9.5 immunohistochemistry. C, H, Merged E18 images. C–E, H–J, Images have DAPI counterstaining to show nuclei. D, E, I, J, Autofluorescence in the green channel was used to highlight the anatomy in adult mice. E, J, Immunohistochemistry for the poly-His tag in the small bowel of mice injected with PBS (E) or His-tagged GDNF (J). D, I, Arrows indicate myenteric ganglia. Arrowheads indicate submucosal ganglia. J, Arrows show the myenteric region. * indicates the submucosal region. Arrowheads identify blood vessels. Scale bar: (in A) A–C, F–H, 25 μm; D, E, I, J, 50 μm. K, Gdnf mRNA levels are elevated in GFAP–Gdnf mice compared with WT littermates in both the small bowel and colon at E18, P0, and P35. Relative gut Gdnf mRNA levels were determined by quantitative real-time PCR after reverse transcription. The level of Gdnf mRNA in WT P35 small bowel was set to 1. *p < 0.05 versus WT for each time point.
Figure 2.
Figure 2.
Submucosal neuron number is increased in GDNF-injected mice. A–D, Acetylcholinesterase-expressing submucosal neurons are more abundant in GDNF-injected mouse small bowel (B) and colon (D) than in PBS-injected WT littermates (A, C). Quantitative data are in Table 1 and supplemental Table 1 (available at www.jneurosci.org as supplemental material). Scale bar (in A), 100 μm.
Figure 3.
Figure 3.
Increased GDNF influences some aspects of myenteric plexus morphogenesis. NADPH-d myenteric neuron fibers have a higher density around enteric ganglia in GFAP–Gdnf mice (E) than WT animals (A), but mice injected with GDNF (F) do not have an increase in NADPH-d-stained neuronal fibers around enteric ganglia compared with controls (B). Tryptophan hydroxylase (C, G) and acetylcholinesterase (D, H) stained myenteric plexus in WT (C, D) and GFAP–Gdnf transgenic mice (G, H) appear similar. Scale bar (in A), 100 μm.
Figure 4.
Figure 4.
NADPH-d-positive myenteric neurons are increased in GFAP–Gdnf mice, but ChAT neurons are comparable in abundance to WT animals. To determine whether GDNF overexpression differentially affects the abundance of specific neuronal subpopulations, colon myenteric plexus was simultaneously labeled by ChAT immunohistochemistry (A, C, D, F) and NADPH-d histochemistry (B, C, E, F). C, F, For these images, NADPH-d neurons and fibers are shown using pseudo-color to facilitate combining fluorescent (A, D) and bright-field (B, E) images and to make details in both images visible. G, H, Quantitative analysis of the number of ChAT or NADPH-d neurons per ganglia in the small bowel (G) and colon (H). n = 4 mice of each genotype and 20 fields (0.25 mm2) per mouse. Error bars represent ± SEM. *p < 0.05 versus WT. Scale bar, 50 μm.
Figure 5.
Figure 5.
Esophageal innervation is influenced by increased GDNF. A, NADPH-d myenteric neurons in WT esophagus or from PBS-injected mice are typically found in small clusters with a few small neuronal fibers between ganglia. B, GFAP–Gdnf mice had more esophageal neurons and a dramatic accumulation of neuronal fibers near enteric ganglia. GDNF-injected mice (C) and Myo–Gdnf (D) had more abundant neurons, as well as a higher density of neuronal fibers. Scale bar, 100 μm.
Figure 6.
Figure 6.
Because ENS precursors have regional and temporal differences in proliferation rates that change during development, increased GDNF leads to increased precursor proliferation in subsets of cells that have not yet exited the cell cycle. A, The percentage of PGP9.5-expressing cells that labeled with BrdU was determined in different regions of the bowel at E17, E18, P0, P3, P5, and P8. B, Proliferation rates for PGP9.5-expressing enteric neurons were also determined in mice injected with GDNF daily from P0 to P5 or P0 to P8. C, D, PGP9.5/BrdU double-labeled immunohistochemistry in mice injected with PBS (C) or GDNF (D) from P0 to P5. Mice were analyzed at P5, 3 h after BrdU injection. Arrow indicates a PGP9.5/BrdU double-positive cell. Arrowheads indicate PGP9.5+ but BrdU-negative cells. n = 3 mice at each age. Error bars represent ± SEM. *p < 0.035 versus WT; **p < 0.005 versus WT. Scale bar, 25 μm.
Figure 7.
Figure 7.
Nerve fiber density in the villus of GDNF-injected mice is increased compared with control littermates. A, PGP9.5 immunoreactive neuronal fibers in a villus from a control mouse. B, PGP9.5-immunoreactive neuronal fibers in a villus from a GDNF-injected mouse. Scale bar, 100 μm.
Figure 8.
Figure 8.
GFAP–Gdnf mice have increased neuronal fiber density near enteric glia. A, D, GFAP immunohistochemistry in WT and GFAP–Gdnf mice. B, E, The same region of the bowel was simultaneously stained using NADPH-d histochemistry. C, F, For these merged images, NADPH-d cells and fibers are pseudo-colored green to facilitate combining fluorescent (A, D) and bright-field (B, E) images and to provide increased contrast to the GFAP immunohistochemistry. Thick nerve fiber bundles accumulate near GFAP-expressing cells in the transgenic mice. Arrows highlight corresponding areas of GFAP and NADPH-d in images. Scale bar, 100 μm.
Figure 9.
Figure 9.
Intestinal contractility and neurotransmitter release are increased in GFAP–Gdnf transgenic mice. A, Circular and longitudinal muscle contractile force was determined after various intensities of electric field stimulation (0.5, 1, 5, and 10 Hz). In all regions evaluated, contractility was stronger in GFAP–Gdnf than in WT mice at 5 or 10 Hz stimulation. B, C, Electric field stimulation results in increased neurotransmitter release for VIP (B) and substance P (C) in both WT and GFAP–Gdnf mice. The increase in transmitter release is greater in GFAP–Gdnf than in WT animals. n = 4 mice of each genotype. Error bars represent ±SEM. *p < 0.05 for GFAP–Gdnf versus WT mice at each electric field strength.
Figure 10.
Figure 10.
Intestinal transit is reduced in Gfrα1+/− and accelerated in GFAP–Gdnf mice. The distribution of FITC-dextran along the length of the bowel was analyzed 1 h after ingestion. A, Gfrα1+/− mice had less FITC in the distal bowel than WT mice. B, GFAP–Gdnf mice had more FITC in the distal bowel than WT mice. WT controls for each mutant mouse line were matched for strain background of the mutant, and transit is different for the two WT mouse strains analyzed. n = 4 mice of each mutant genotype and 4 matched controls.

Similar articles

Cited by

References

    1. Airaksinen MS, Saarma M. The GDNF family: signalling, biological functions and therapeutic value. Nat Rev Neurosci. 2002;3:383–394. - PubMed
    1. Amiel J, Sproat-Emison E, Garcia-Barcelo M, Lantieri F, Burzynski G, Borrego S, Pelet A, Arnold S, Miao X, Griseri P, Brooks AS, Antinolo G, de Pontual L, Clement-Ziza M, Munnich A, Kashuk C, West K, Wong KK, Lyonnet S, Chakravarti A, Tam PK, Ceccherini I, Hofstra RM, Fernandez R. Hirschsprung disease, associated syndromes and genetics: a review. J Med Genet. 2008;45:1–14. - PubMed
    1. Baloh RH, Enomoto H, Johnson EM, Jr, Milbrandt J. The GDNF family ligands and receptors: implications for neural development. Curr Opin Neurobiol. 2000;10:103–110. - PubMed
    1. Blaugrund E, Pham TD, Tennyson VM, Lo L, Sommer L, Anderson DJ, Gershon MD. Distinct subpopulations of enteric neuronal progenitors defined by time of development, sympathoadrenal lineage markers, and Mash-1-dependence. Development. 1996;122:309–320. - PubMed
    1. Cacalano G, Fariñas I, Wang LC, Hagler K, Forgie A, Moore M, Armanini M, Phillips H, Ryan AM, Reichardt LF, Hynes M, Davies A, Rosenthal A. GFRα1 is an essential receptor component for GDNF in the developing nervous system and kidney. Neuron. 1998;21:53–62. - PMC - PubMed

Publication types

MeSH terms

Substances