

Neutralization of osteopontin inhibits obesity-induced inflammation and insulin resistance
- PMID: 20107108
- PMCID: PMC2844841
- DOI: 10.2337/db09-0404
Neutralization of osteopontin inhibits obesity-induced inflammation and insulin resistance
Abstract
Objective: Obesity is associated with a state of chronic low-grade inflammation mediated by immune cells that are primarily located to adipose tissue and liver. The chronic inflammatory response appears to underlie obesity-induced metabolic deterioration including insulin resistance and type 2 diabetes. Osteopontin (OPN) is an inflammatory cytokine, the expression of which is strongly upregulated in adipose tissue and liver upon obesity. Here, we studied OPN effects in obesity-induced inflammation and insulin resistance by targeting OPN action in vivo.
Research design and methods: C57BL/6J mice were fed a high-fat diet to induce obesity and were then intravenously treated with an OPN-neutralizing or control antibody. Insulin sensitivity and inflammatory alterations in adipose tissue and liver were assessed.
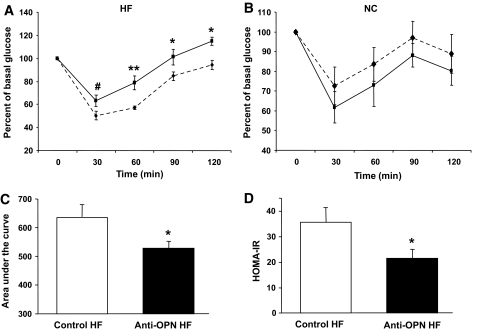
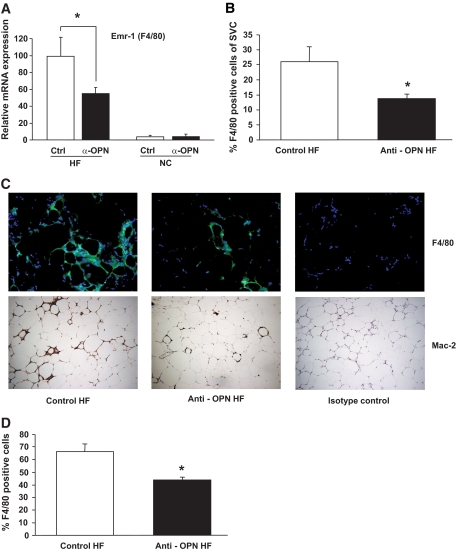
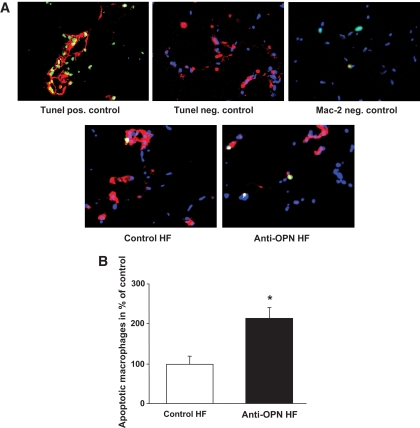
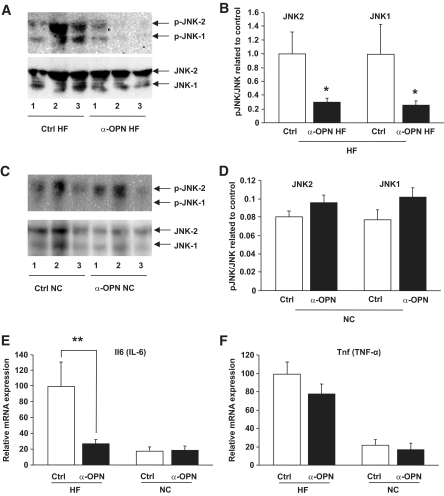
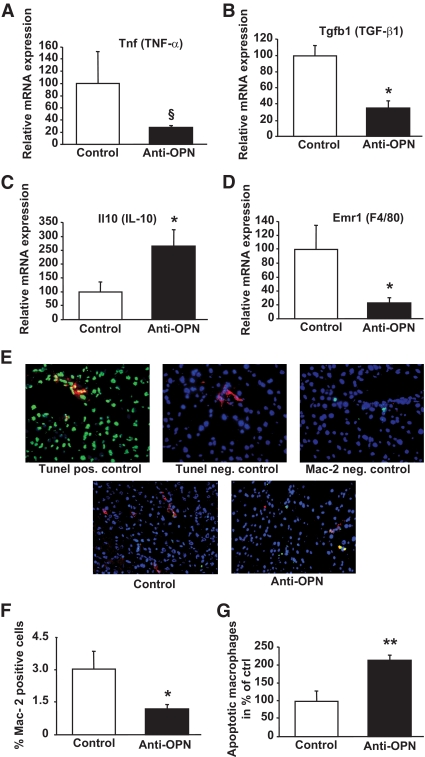
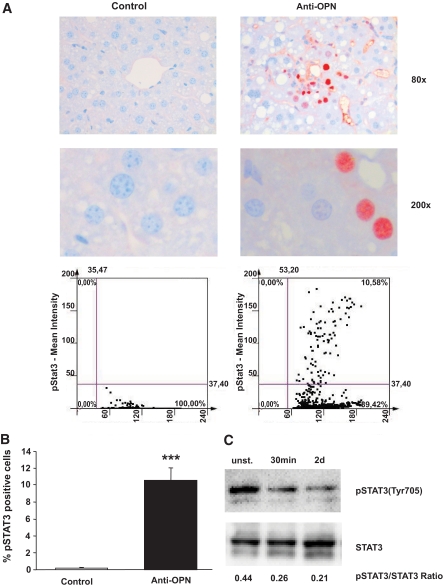
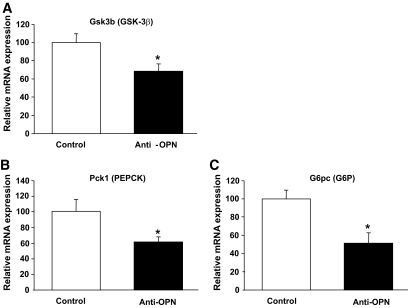
Results: Interference with OPN action by a neutralizing antibody for 5 days significantly improved insulin sensitivity in diet-induced obese mice. Anti-OPN treatment attenuated liver and adipose tissue macrophage infiltration and inflammatory gene expression by increasing macrophage apoptosis and significantly reducing c-Jun NH(2)-terminal kinase activation. Moreover, we report OPN as a novel negative regulator for the activation of hepatic signal transducer and activator of transcription 3 (STAT3), which is essential for glucose homeostasis and insulin sensitivity. Consequently, OPN neutralization decreased expression of hepatic gluconeogenic markers, which are targets of STAT3-mediated downregulation.
Conclusions: These findings demonstrate that antibody-mediated neutralization of OPN action significantly reduces insulin resistance in obesity. OPN neutralization partially decreases obesity-associated inflammation in adipose tissue and liver and reverses signal transduction related to insulin resistance and glucose homeostasis. Hence, targeting OPN could provide a novel approach for the treatment of obesity-related metabolic disorders.
Figures
Similar articles
-
Osteopontin deficiency protects against obesity-induced hepatic steatosis and attenuates glucose production in mice.Diabetologia. 2011 Aug;54(8):2132-42. doi: 10.1007/s00125-011-2170-0. Epub 2011 May 12. Diabetologia. 2011. PMID: 21562757 Free PMC article.
-
Dietary capsaicin reduces obesity-induced insulin resistance and hepatic steatosis in obese mice fed a high-fat diet.Obesity (Silver Spring). 2010 Apr;18(4):780-7. doi: 10.1038/oby.2009.301. Epub 2009 Oct 1. Obesity (Silver Spring). 2010. PMID: 19798065
-
Osteopontin expression in human and murine obesity: extensive local up-regulation in adipose tissue but minimal systemic alterations.Endocrinology. 2008 Mar;149(3):1350-7. doi: 10.1210/en.2007-1312. Epub 2007 Nov 29. Endocrinology. 2008. PMID: 18048491
-
Recent advances in the relationship between obesity, inflammation, and insulin resistance.Eur Cytokine Netw. 2006 Mar;17(1):4-12. Eur Cytokine Netw. 2006. PMID: 16613757 Review.
-
B Lymphocytes in obesity-related adipose tissue inflammation and insulin resistance.Cell Mol Life Sci. 2014 Mar;71(6):1033-43. doi: 10.1007/s00018-013-1486-y. Epub 2013 Oct 15. Cell Mol Life Sci. 2014. PMID: 24127133 Free PMC article. Review.
Cited by
-
Adipose tissue macrophages in remote modulation of hepatic glucose production.Front Immunol. 2022 Aug 24;13:998947. doi: 10.3389/fimmu.2022.998947. eCollection 2022. Front Immunol. 2022. PMID: 36091076 Free PMC article. Review.
-
The multifaceted progenitor fates in healthy or unhealthy adipose tissue during obesity.Rev Endocr Metab Disord. 2021 Dec;22(4):1111-1119. doi: 10.1007/s11154-021-09662-0. Epub 2021 Jun 8. Rev Endocr Metab Disord. 2021. PMID: 34105090 Review.
-
Impaired local production of proresolving lipid mediators in obesity and 17-HDHA as a potential treatment for obesity-associated inflammation.Diabetes. 2013 Jun;62(6):1945-56. doi: 10.2337/db12-0828. Epub 2013 Jan 24. Diabetes. 2013. PMID: 23349501 Free PMC article.
-
Wogonin suppresses osteopontin expression in adipocytes by activating PPARα.Acta Pharmacol Sin. 2015 Aug;36(8):987-97. doi: 10.1038/aps.2015.37. Epub 2015 Jun 15. Acta Pharmacol Sin. 2015. PMID: 26073326 Free PMC article.
-
[Parathyroid hormone-related protein aggravates nonalcoholic fatty liver disease induced by methionine choline-deficient diet in mice].Nan Fang Yi Ke Da Xue Xue Bao. 2021 Jul 20;41(7):1037-1043. doi: 10.12122/j.issn.1673-4254.2021.07.10. Nan Fang Yi Ke Da Xue Xue Bao. 2021. PMID: 34308853 Free PMC article. Chinese.
References
-
- Despres JP, Lemieux I: Abdominal obesity and metabolic syndrome. Nature 2006; 444: 881– 887 - PubMed
-
- Bastard JP, Maachi M, Lagathu C, Kim MJ, Caron M, Vidal H, Capeau J, Feve B: Recent advances in the relationship between obesity, inflammation, and insulin resistance. Eur Cytokine Netw 2006; 17: 4– 12 - PubMed
-
- Shoelson SE, Herrero L, Naaz A: Obesity, inflammation, and insulin resistance. Gastroenterology 2007; 132: 2169– 2180 - PubMed
-
- Hotamisligil GS: Inflammation and metabolic disorders. Nature 2006; 444: 860– 867 - PubMed
Publication types
MeSH terms
Substances
LinkOut - more resources
Full Text Sources
Other Literature Sources
Medical
Molecular Biology Databases
Research Materials
Miscellaneous
