. 2010 Apr;103(4):1915-26.
doi: 10.1152/jn.00751.2009. Epub 2010 Jan 27.

A low-affinity antagonist reveals saturation and desensitization in mature synapses in the auditory brain stem

Affiliations

A low-affinity antagonist reveals saturation and desensitization in mature synapses in the auditory brain stem

Soham Chanda et al. J Neurophysiol. 2010 Apr.

Abstract

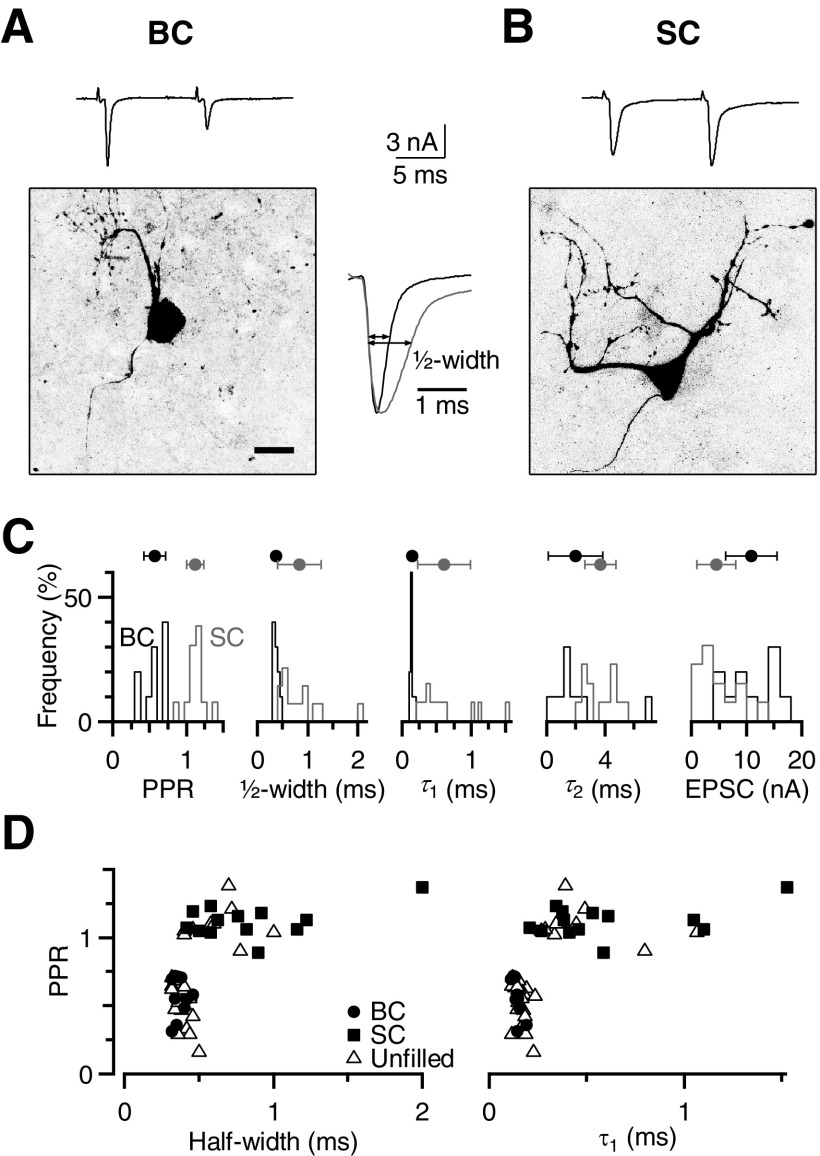
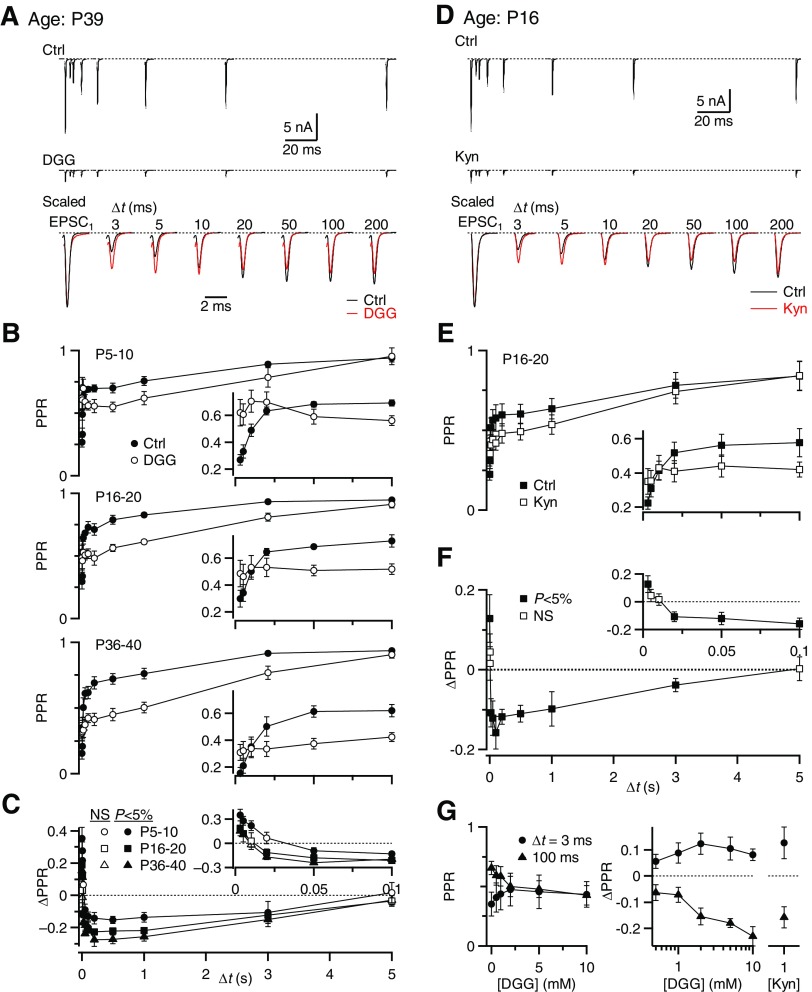
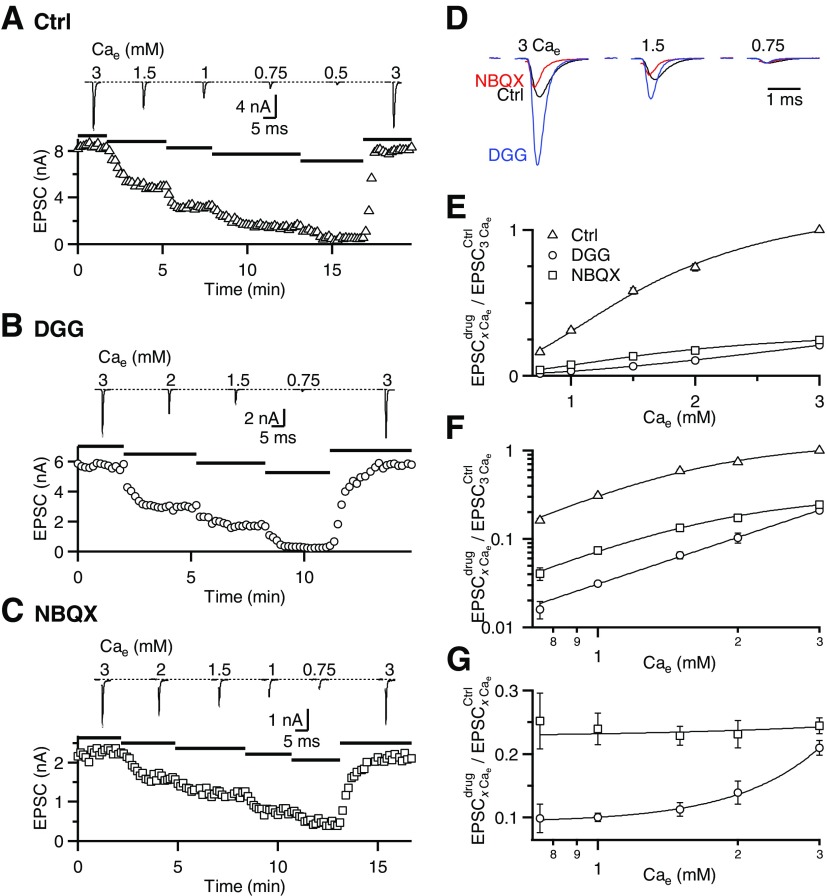
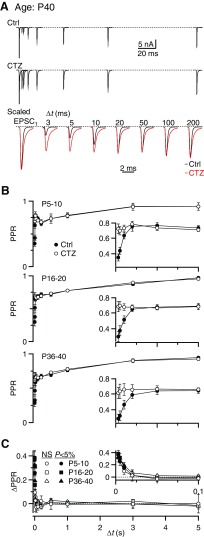
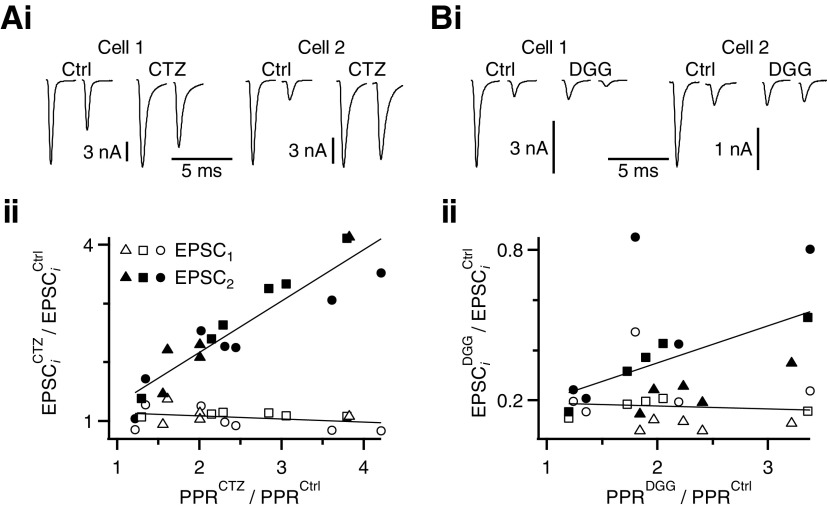
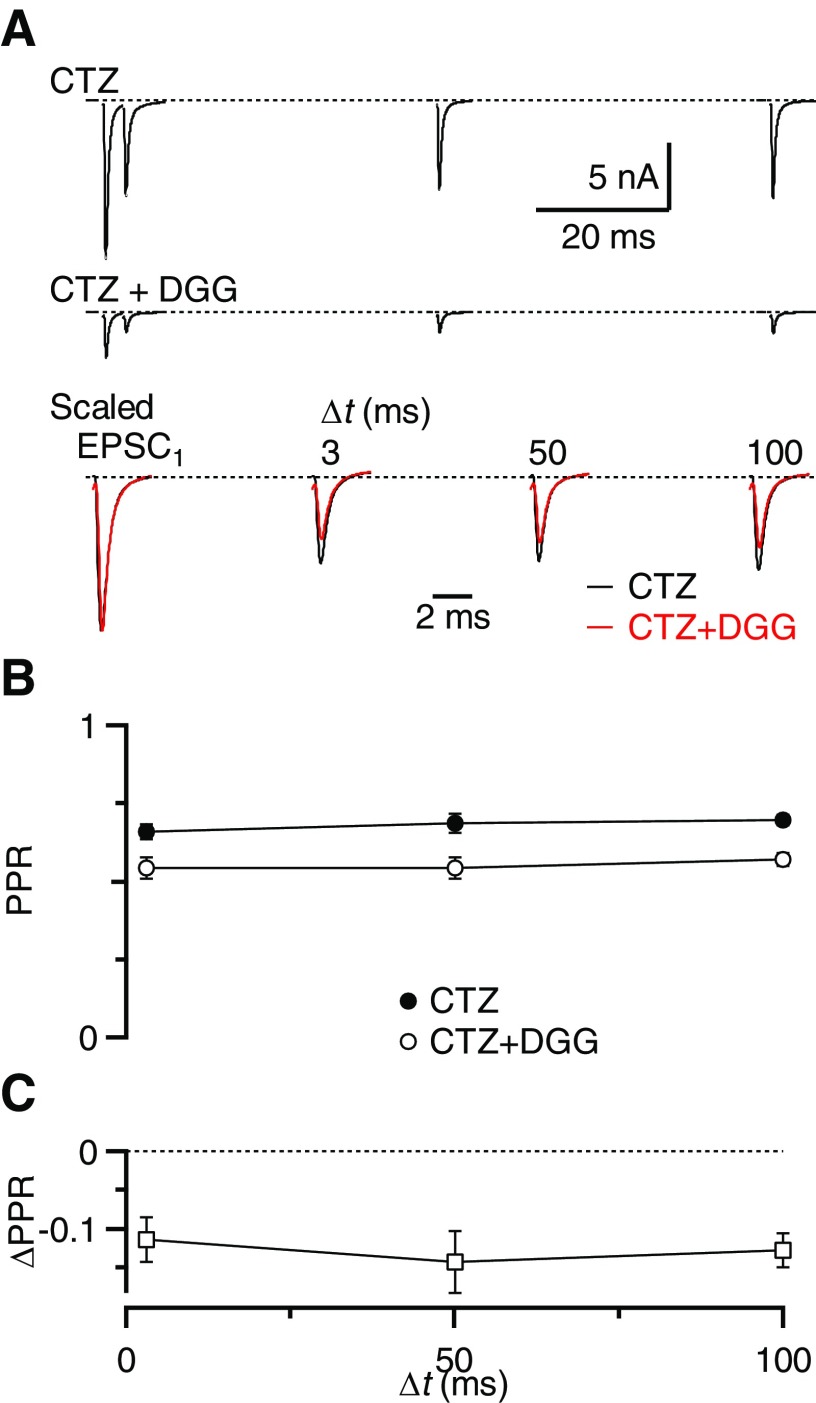
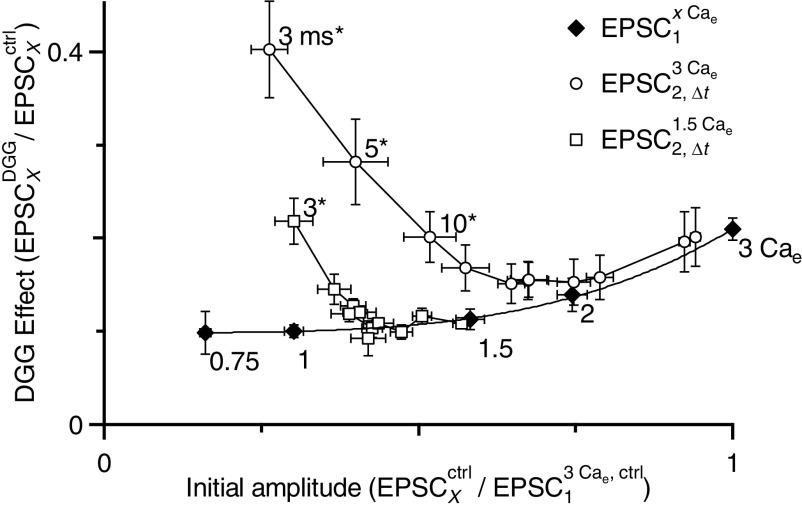
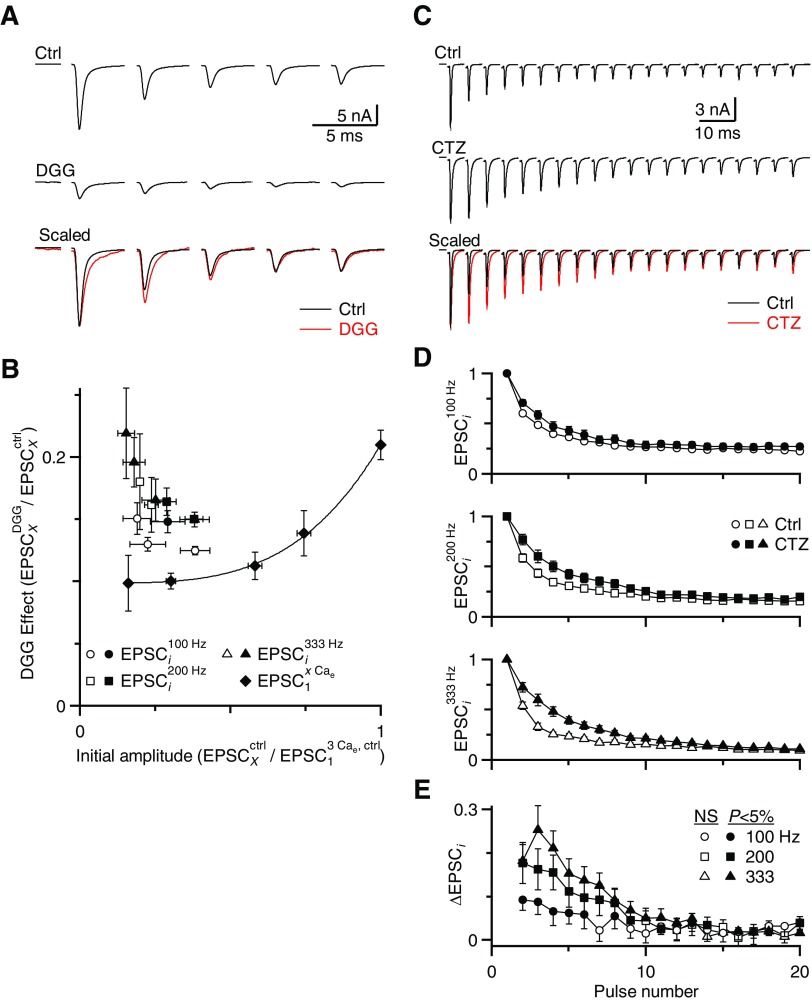
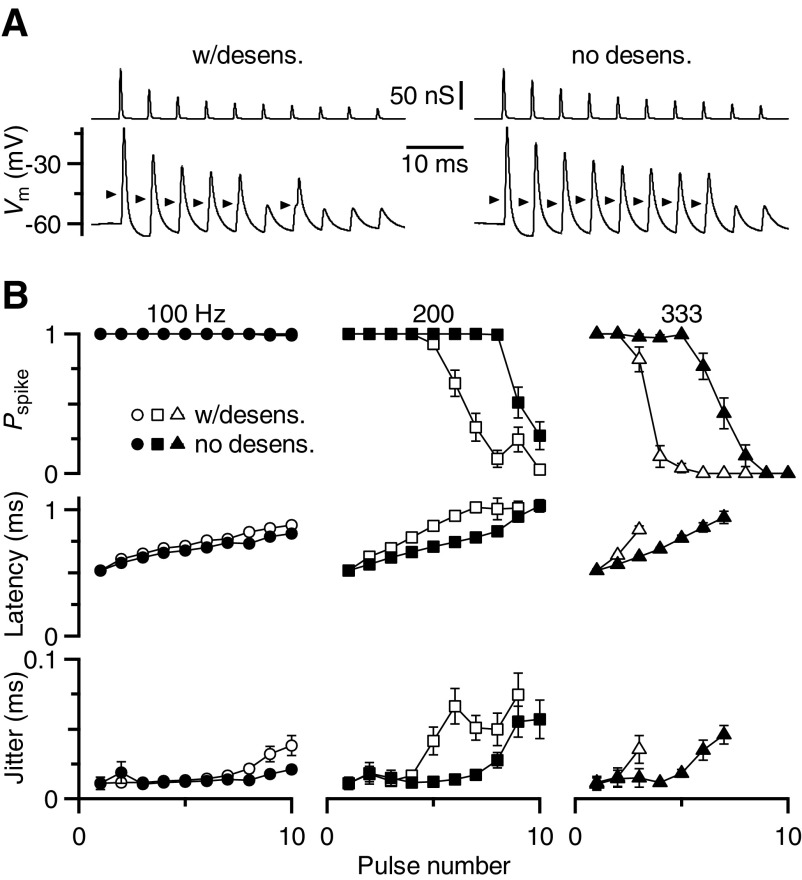
Postsynaptic receptor desensitization has been observed to contribute to depression in immature synapses. However, it is not clear whether desensitization persists and causes depression in mature synapses. We investigate this issue at the endbulb of Held, the synapse made by auditory nerve (AN) fibers onto bushy cells (BCs) of the anteroventral cochlear nucleus, where depression could influence the processing of sound information. Experiments using cyclothiazide (CTZ) have implicated desensitization in endbulbs from postnatal day 16 (P16) to P21 mice, but application of γ-D-glutamylglycine (DGG) did not reveal desensitization in endbulbs >P22. To reconcile these findings, we have studied the effects of both CTZ and DGG on endbulbs from P5 to P40 CBA/CaJ mice. In paired-pulse protocols, both CTZ and DGG reduced depression in all ages at intervals <10 ms, consistent with their effects preventing desensitization. However, DGG increased depression at intervals >20 ms, consistent with DGG's use to prevent saturation. DGG application revealed receptor saturation even under conditions of very low release probability. Preventing desensitization by CTZ occluded the effects of DGG on desensitization and revealed the effects of saturation at short intervals. We developed an approach to separate DGG's effect on saturation from its effect on desensitization, which showed that desensitization has an impact during bursts of auditory nerve activity. Dynamic-clamp experiments indicated that desensitization can reduce BC spike probability and increase latency and jitter. Thus desensitization may affect sound processing in the mature auditory system.


Figures

Fig. 1.
Fig. 1.
Distinguishing bushy cells (BCs) from stellate cells (SCs) in voltage-clamp recordings in the anteroventral cochlear nucleus (AVCN). A and B: identification of cell type using anatomical criteria. Confocal images of a representative BC (A) and SC (B), with excitatory postsynaptic currents (EPSCs) recorded in response to paired stimulation of a single excitatory input (Δt = 10 ms). Cells were patched using a recording pipette containing Alexa-594, which was then pulled off the cell before confocal imaging. The BC has a single dendritic arbor and shows paired-pulse depression, whereas the SC has multiple dendrites and shows paired-pulse facilitation. The scale bar is 20 μm. The inset between the images shows the first EPSC for both cells on an expanded timescale. For the example BC, τ1 = 0.21 ms, τ2 = 5.12 ms, and half-width = 0.46 ms. For the example SC, τ1 = 0.39, τ2 = 5.8, and half-width = 0.92 ms. C: histograms of EPSC properties for anatomically identified BCs and SCs. Paired-pulse ratio (PPR), half-width, and τ1 can distinguish between these 2 cell populations, but EPSC amplitude and τ2 are less favorable. Average values for the identified population are indicated by markers above the histograms (error bars indicate SD of the population in this figure only). D: the PPR plotted against half-width and τ1 from a larger population of cells. Closed symbols are those identified on the basis of anatomical structure, whereas open symbols are unidentified. All cells clearly fall into 2 distinct groups.
Fig. 2.
Fig. 2.
γ-d-Glutamylglycine (DGG) has multiple effects on paired-pulse plasticity at all ages. Auditory nerve (AN) inputs were stimulated with pairs of pulses at different time intervals (Δt) in 3 mM external calcium (3 Cae). Data are shown together for simplicity, but were collected in different trials in this and following figures. A: example traces recorded from a P39 BC in control conditions (top) and in 5 mM DGG (middle). The bottom panel shows control and DGG traces scaled by the EPSC1 amplitude. B: average results for 5 BCs each from P5–P10 (top), P16–P20 (middle), and P36–P40 animals (bottom). The insets expand the intervals Δt = 3 to 100 ms. C: the change in PPR (ΔPPR) is shown for 3 different age groups. Significant differences from 0 are indicated with filled symbols (P < 0.05). D: example recordings from a P16 BC in control (top) and in 1 mM kynurenate (middle). In the bottom panel, control and kynurenate traces have been scaled by their corresponding EPSC1 amplitude. E: average results for 6 BCs from P16–P20. F: the ΔPPR by kynurenate application for the cells in E. G: dose–response curve for PPR at Δt = 3 and 100 ms over different DGG concentrations (left). The ΔPPRs with respect to control conditions are shown for DGG (middle) and 1 mM kynurenate (right). All points are significantly different from 0 (P < 0.05), except for 0.5 mM DGG. Over the concentration range from 2 to 10 mM DGG, the effects on PPR were not statistically different (P > 0.1 for all pairwise comparisons, 2-tailed paired t-test, n = 5 cells). The effects of 1 mM kynurenate and 2 to 10 mM DGG were not statistically different (P > 0.1 for all pairwise comparisons, unpaired t-test; n = 7 cells in kynurenate).
Fig. 3.
Fig. 3.
DGG reveals saturation at the endbulb of Held. EPSC amplitudes measured in different Cae for 3 representative cells, measured in control conditions (A), in 5 mM DGG (B), and in 250 nM 2,3-dihydroxy-6-nitro-7-sulfamoyl-benzo[f]quinoxaline-2,3-dione (NBQX, C). Bottom panels show the peak EPSC amplitude over the course of the experiment. Top traces are average EPSCs when wash-in of each Cae had stabilized. D: average EPSCs for the experiments shown in AC overlaid and scaled by the EPSC peak in 0.75 Cae, where saturation is presumably minimal. This indicates that DGG block is lower in high Cae, probably because of saturation. E and F: average EPSC amplitudes in control (8 to 23 cells), DGG (6 to 39 cells), and NBQX (7 to 25 cells) in different Cae, normalized to 3 Cae to allow averaging across experiments. Data are pooled for endbulbs from animals P16–P40. Data are fit using a Hill equation for control and NBQX and to a power law for DGG (see results). Data are plotted on a linear scale (E) or log-log (F). G: block by DGG (circles) and NBQX (squares) for each Cae. The greater block by DGG at low Cae indicates saturation. Constant block by NBQX indicates that the effects of DGG do not result from improved voltage clamp. The NBQX and DGG data are fitted with a straight line and power-law, respectively.
Fig. 4.
Fig. 4.
Cyclothiazide (CTZ) reduces depression at short intervals similarly at all ages. A: example traces from a P40 BC in control conditions (top) and in 50 μM CTZ (middle). The bottom panel shows control and CTZ traces scaled by the EPSC1 amplitude. B: average results for 5 BCs from P5–P10 (top), 6 BCs from P16–P20 (middle), and 7 BCs from P36–P40 animals (bottom). The insets expand the intervals Δt = 3 to 100 ms. C: the ΔPPR is shown for both age groups. Filled symbols indicate points that differ significantly from 0 for both groups (P < 0.05).
Fig. 5.
Fig. 5.
The increase in PPR in CTZ and DGG for an interpulse interval of 3 ms is consistent with desensitization, not saturation, at all ages. Ai and Bi: example cells showing that application of CTZ and DGG have similar effects on EPSC1, but differential effects on EPSC2. Aii and Bii: relative changes in EPSC1 and EPSC2 amplitude are plotted with respect to relative changes in PPR for each individual endbulb. Data from different ages are indicated by triangles (P5–P10), squares (P16–P20), and circles (P36–P40). Data are fit using straight lines. EPSC1 is affected uniformly by CTZ (Aii) and DGG (Bii), but the effects on EPSC2 depend on the change in PPR. This is consistent with the idea that CTZ and DGG relieve desensitization (see results).
Fig. 6.
Fig. 6.
CTZ occludes the effect of DGG on desensitization. A: example traces in the presence of CTZ (top) and CTZ + DGG (middle), for paired-pulse stimulation at Δt = 3, 50, and 100 ms. The bottom panel shows CTZ and CTZ + DGG traces scaled by the EPSC1 amplitude. B: average results for 8 BCs from animals P16–P40. PPR decreases uniformly at all intervals, indicating that CTZ abolished desensitization, so subsequent DGG reveals only saturation. C: the ΔPPR for the experiments in B is similar for all interpulse intervals and all are significantly below 0 (P < 0.05).
Fig. 7.
Fig. 7.
Distinguishing the effects of DGG on desensitization and saturation. The initial EPSC amplitude for all conditions is normalized to the resting EPSC in 3 Cae and the effect of DGG is calculated as the relative EPSC amplitude after DGG application. Closed symbols are the results of experiments in which Cae was varied. The initial EPSC amplitude is given by EPSC1xCae/EPSC13Cae and the effect of DGG is given by EPSC1DGG,xCae/EPSC1Ctrl,xCae. The line is a fit to these data using a power law (see results). The effect of DGG under these conditions depends on receptor saturation, so the fit is termed the “saturation curve.” Open symbols are the results of paired-pulse experiments in 1.5 (squares) or 3 (circles) Cae. The initial EPSC amplitude is given by EPSC2,ΔtxCae/EPSC13Cae and the effect of DGG is given by EPSC2,ΔtDGG,xCae/EPSC2,ΔtCtrl,xCae. The shortest intervals are at the top left and move down and to the right at longer intervals. Intervals that differ significantly from the saturation curve are labeled and marked by asterisks (see results). The EPSCs at short intervals differ from the saturation curve, most likely because DGG prevented desensitization. Data were pooled from experiments on endbulbs from animals P16–P40.
Fig. 8.
Fig. 8.
Desensitization persists during longer periods of activity. The presynaptic AN fiber was stimulated with trains of pulses in 1.5 Cae and the effects of DGG and CTZ were studied. A: EPSCs during 200-Hz trains for a representative experiment in control (top) and in DGG (middle). In the bottom panel, these traces are shown with EPSC1 amplitudes scaled to the same size. B: average data from 4 experiments are plotted similarly to Fig. 7. The line and solid symbols indicate the effects of DGG on EPSCs recorded in different Cae conditions (the saturation curve). Open symbols indicate the effect of DGG on EPSCs during 100-, 200-, and 333-Hz trains. The initial EPSC amplitude for the ith pulse in a train is given by EPSCixCae/EPSC13Cae and the effect of DGG is given by EPSCiDGG,xCae/EPSCiCtrl,xCae. The data for EPSC1 of the trains lie on the saturation curve, with later pulses extending toward the top left. Pulses that differed significantly from the saturation curve (P < 0.05) are plotted as filled symbols, indicating they showed significant desensitization. C: EPSCs during 200-Hz trains for a representative experiment in control (top) and in CTZ (middle). In the bottom panel, these traces are shown with EPSC1 amplitudes scaled to the same size. D: average changes in relative EPSC amplitude after CTZ application are shown over the course of 100-, 200-, and 333-Hz trains. This is calculated after normalizing to the first pulse in the train (analogous to ΔPPR in Figs. 2, 4, and 6). Points are averages of 11 or 12 cells from animals P16–P40. Filled symbols represent a significant increase in EPSC amplitude by CTZ at P < 0.05 (t-test).
Fig. 9.
Fig. 9.
Effect of desensitization on BC firing properties. A: example dynamic-clamp traces showing conductance waveforms (top) and BC response (bottom). Conductance waveforms were based on peak EPSC amplitudes during 200-Hz trains in control (left) or CTZ (right) conditions. Arrows mark spike threshold, as estimated using the first or second derivative of the trace. B: average results from 17 cells, showing probability of spiking, latency, and jitter during dynamic-clamp experiments of 100-, 200-, and 333-Hz trains, with and without desensitization. Latency and jitter were undefined when the probability of spiking was low; points are shown only in which measurable values could be obtained in ≥5 experiments.

Similar articles

Cited by

References

    1. Bellingham MC, Walmsley B. A novel presynaptic inhibitory mechanism underlies paired pulse depression at a fast central synapse. Neuron 23: 159–170, 1999. - PubMed
    1. Brawer JR, Morest DK. Relations between auditory nerve endings and cell types in the cat's anteroventral cochlear nucleus seen with the Golgi method and Nomarski optics. J Comp Neurol 160: 491–506, 1975. - PubMed
    1. Brawer JR, Morest DK, Kane EC. The neuronal architecture of the cochlear nucleus of the cat. J Comp Neurol 155: 251–300, 1974. - PubMed
    1. Brenowitz S, Trussell LO. Maturation of synaptic transmission at end-bulb synapses of the cochlear nucleus. J Neurosci 21: 9487–9498, 2001. - PMC - PubMed
    1. Chen C, Blitz DM, Regehr WG. Contributions of receptor desensitization and saturation to plasticity at the retinogeniculate synapse. Neuron 33: 779–788, 2002. - PubMed

Publication types

LinkOut - more resources