. 2010 Apr;103(4):2002-14.
doi: 10.1152/jn.01038.2009. Epub 2010 Jan 27.

Singing-related neural activity distinguishes four classes of putative striatal neurons in the songbird basal ganglia

Affiliations

Singing-related neural activity distinguishes four classes of putative striatal neurons in the songbird basal ganglia

Jesse H Goldberg et al. J Neurophysiol. 2010 Apr.

Abstract

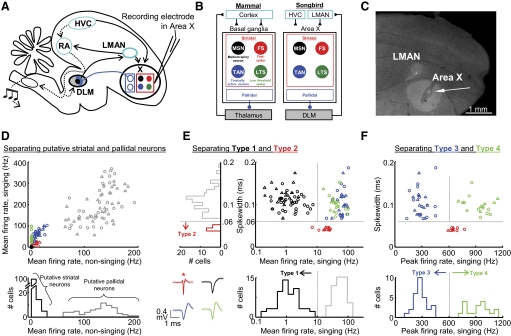
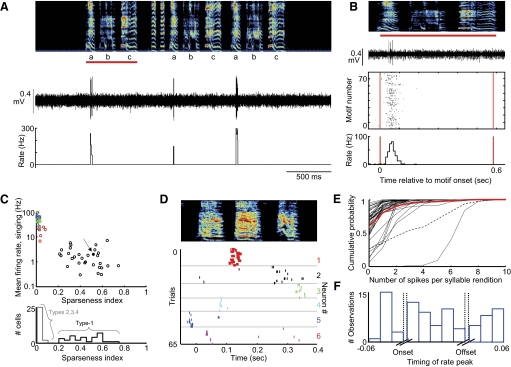
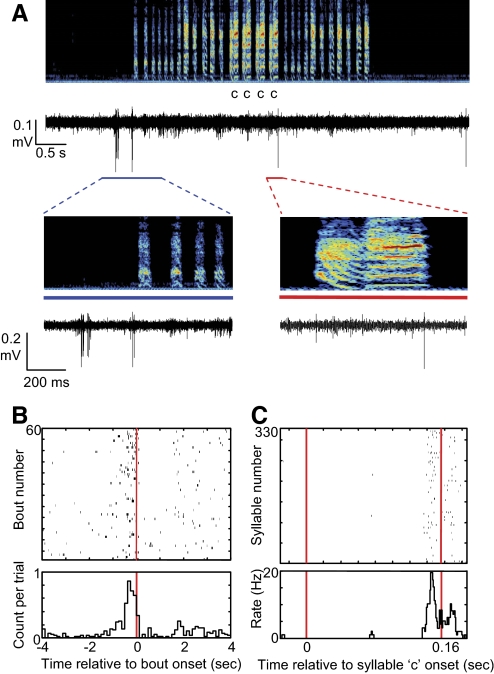
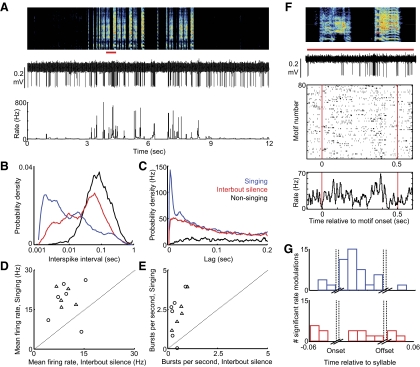
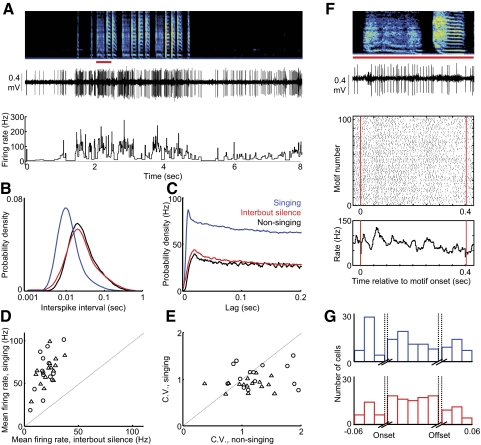
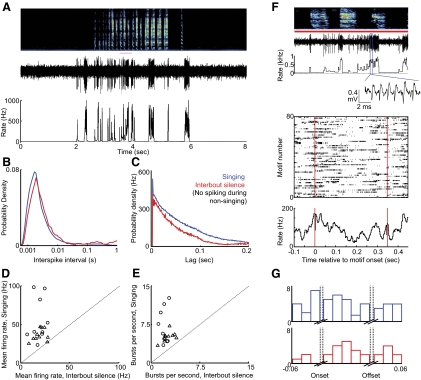
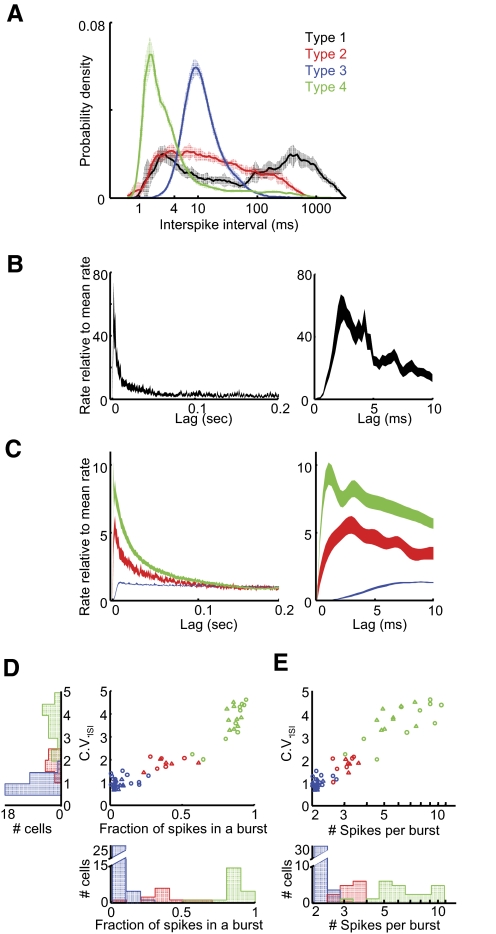
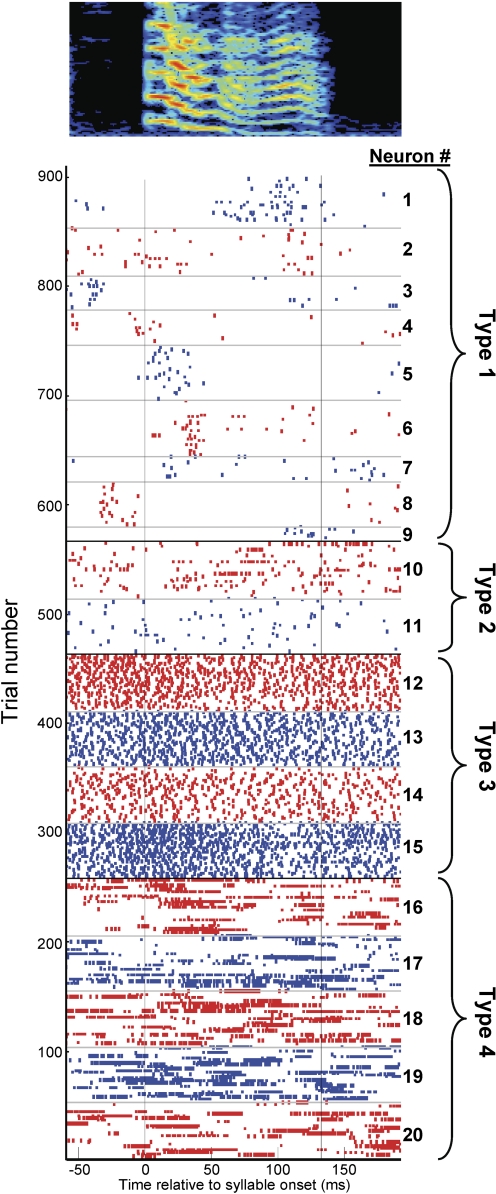
The striatum-the primary input nucleus of the basal ganglia-plays a major role in motor control and learning. Four main classes of striatal neuron are thought to be essential for normal striatal function: medium spiny neurons, fast-spiking interneurons, cholinergic tonically active neurons, and low-threshold spiking interneurons. However, the nature of the interaction of these neurons during behavior is poorly understood. The songbird area X is a specialized striato-pallidal basal ganglia nucleus that contains two pallidal cell types as well as the same four cell types found in the mammalian striatum. We recorded 185 single units in Area X of singing juvenile birds and, based on singing-related firing patterns and spike waveforms, find six distinct cell classes--two classes of putative pallidal neuron that exhibited a high spontaneous firing rate (> 60 Hz), and four cell classes that exhibited low spontaneous firing rates characteristic of striatal neurons. In this study, we examine in detail the four putative striatal cell classes. Type-1 neurons were the most frequently encountered and exhibited sparse temporally precise singing-related activity. Type-2 neurons were distinguished by their narrow spike waveforms and exhibited brief, high-frequency bursts during singing. Type-3 neurons were tonically active and did not burst, whereas type-4 neurons were inactive outside of singing and during singing generated long high-frequency bursts that could reach firing rates over 1 kHz. Based on comparison to the mammalian literature, we suggest that these four putative striatal cell classes correspond, respectively, to the medium spiny neurons, fast-spiking interneurons, tonically active neurons, and low-threshold spiking interneurons that are known to reside in area X.


Figures

Fig. 1.
Fig. 1.
Singing-related neural activity distinguishes four classes of putative striatal neurons in area X. A: schematic of the avian song circuit showing the anterior forebrain pathway (AFP, —) containing the basal ganglia structure area X, and the motor pathway (···). B: the songbird area X is a striato-pallidal structure that resides in a thalamo-cortical loop. Four cell classes found in the mammalian striatum are also found in area X: medium spiny neurons, fast spiking interneurons (FS), tonically active neurons (TANs), and low-threshold spiking interneurons (LTS). C: representative histology for area X recordings. Small electrolytic lesions were made with the recording electrodes (←) to verify electrode position within area X. D, top: the mean firing rate during singing is plotted against the mean firing rate during nonsinging epochs for all neurons recorded in Area X. Bottom: histogram of nonsinging firing rates separates 2 classes of neurons: putative pallidal neurons that fired at high rates (>50 Hz), and putative striatal neurons that fired at low rates (<30 Hz). E: for all putative striatal neurons, the spike width is plotted against the mean firing rate during singing. The bottom histogram distinguishes type-1 neurons, which fired at low rates during singing (<10 Hz). Left: histogram distinguishes type-2 neurons, which had thin spike widths (<0.06 ms, see methods). Inset: spike waveforms (means ± SD, n = 50 spikes) from representative neurons of each cell class. *, thin spike of a type-2 neuron. F: for all putative striatal neurons (excluding type-1), the spikewidth is plotted against the peak firing rate during singing (99th percentile rate, see methods). Histogram of peak firing rate distinguishes an additional 2 classes of neurons: type-3 neurons that do not generate high-frequency discharge (peak rate: <600 Hz), and type-4 neurons that do (peak rate: >600 Hz). For all scatter plots, ▵ and ○, neurons recorded from subsong and plastic song birds, respectively.
Fig. 2.
Fig. 2.
Type-1 neurons exhibit sparse, temporally precise singing-related activity. A: the raw voltage trace of a type-1 neuron and its instantaneous firing rate (see methods) are plotted beneath the spectrogram (age 64 dph). Note that this neuron spikes only during syllable “a” of a 3-syllable motif. B, top: expanded view of the voltage and spectrogram from the 1st motif from B (indicated by red bar). Middle: spike raster indicating spiking activity of this neuron during 73 renditions of the motif. Bottom: rate histogram compiled from the raster plot. C, top: for each putative striatal neuron recorded in a plastic song bird, the mean firing rate during singing is plotted against the sparseness index; color code as in Fig. 1 (see methods). The neuron from A and B is labeled with a solid black dot and an arrow. Bottom: histogram of sparseness index. D: spectrogram and spike raster of 6 type-1 neurons recorded in one bird (different bird from A and B) during ages 61–65 days post hatch (dph). Each neuron exhibits sparse activity temporally localized to distinct parts of a 3-syllable motif. E: cumulative probability plots of the number of spikes generated per syllable for all type-1 neurons recorded in plastic song birds. Red trace represents the average of 44 syllables from 31 neurons, and the dashed trace is from the neuron in A and B. Syllables that never contained a spike were excluded from this analysis. F: population histogram showing the distribution of significant rate peaks as a function of syllable timing. Data were compiled from 44 syllables from 31 type-1 neurons. Note that significant peaks occur throughout the syllables.
Fig. 3.
Fig. 3.
Example of a type-1 neuron the activity of which was correlated with both bout onsets as well as a specific syllable. A: the raw voltage trace is plotted beneath the spectrogram (age dph 69). Note neuronal discharge that immediately precedes the onset of the song bout. An additional spike occurs during some renditions of syllable “c.” Bottom: expanded views of the periods indicated by the blue line and red lines, respectively. B: song bout onset aligned spike raster, showing neural activity aligned to the onset of 60 consecutive bouts and the rate histogram of the raster, showing a peak in the probability of spiking that precedes bout onset. C: data are layed out as in B for neural activity aligned to 330 renditions of syllable c.
Fig. 4.
Fig. 4.
Thin-spiking, type-2 neurons exhibit brief high-frequency bursts during singing. A: the raw voltage trace of a representative type-2 neuron and its instantaneous firing rate (see methods) are plotted beneath the song spectrogram (age 61 dph). B: interspike interval (ISI) distributions for the neuron shown in A during nonsinging (black), singing (blue), and interbout silent periods (red, see methods). C: spike train autocorrelation for the neuron from A exhibiting a narrow peak representing the brief bursts during singing. D: for each type-2 neuron, the mean firing rate during singing is plotted against the mean rate during interbout silence. E: the number of bursts per second during singing is plotted against burst incidence during interbout periods for each type-2 neuron. Triangles and circles, cells from subsong and plastic song birds, respectively. F, top: expanded view of a segment of the voltage waveform and spectrogram from B (indicated by red bar). Middle: spike raster showing activity of this neuron during 80 renditions of a 2-syllable motif. Bottom: rate histogram compiled from the raster plot. G: population histogram showing the distribution of significant rate peaks (blue) and rate minima (red) as a function of syllable timing (14 syllables from 6 type-2 neurons). Note that significant modulations occur throughout the syllables.
Fig. 5.
Fig. 5.
Type-3 neurons are tonically active and do not generate high-frequency bursts. A: the raw voltage trace of a representative type-3 neuron and its instantaneous firing rate (see methods) are plotted beneath the song spectrogram (58-day-old bird). B: ISI distributions for the neuron shown in A during nonsinging (black), singing (blue), and interbout silent silence (red, see methods). C: spike train autocorrelation for the neuron from A. D: for each type-3 neuron, the mean firing rate during singing is plotted against the mean rate during interbout periods. E: the number of bursts per second during singing is plotted against burst incidence during interbout silence for each type-3 neuron. Triangles and circles, cells from subsong and plastic song birds, respectively. F, top: expanded view of the voltage and spectrogram from A (indicated by red bar). Middle: spike raster showing activity of this neuron during 100 renditions of the motif; bottom: the rate histogram compiled from the raster plot. G: population histogram showing the distribution of significant rate peaks (blue) and rate minima (red) as a function of syllable timing (54 syllables from 14 type-3 neurons). Note that significant modulations occur throughout the syllables.
Fig. 6.
Fig. 6.
Type-4 neurons exhibit broad, high-frequency bursts in excess of 1 kHz during singing. A: the raw voltage trace of a representative type-4 neuron and its instantaneous firing rate (see methods) are plotted beneath the song spectrogram (age 64 dph). B: ISI distributions for the neuron shown in A during singing (blue) and interbout silence (red, see methods). Type-4 neurons did not spike during nonsinging periods. C: spike train autocorrelation for the neuron from A. Note the broad peak, resulting from the long bursts of these neurons. D: for each type-4 neuron, the mean firing rate during singing is plotted against the mean rate during interbout periods. E: the number of bursts per second during singing is plotted against burst incidence during interbout periods for each type-4 neuron. Triangles and circles, cells from subsong and plastic song birds, respectively. F, top: expanded view of the voltage and spectrogram from A (indicated by red bar). Inset: zoom-in on a portion of a high-frequency burst. Bottom: spike raster indicating spiking activity of this neuron during 80 renditions of the motif, and the rate histogram compiled from the raster plot. G: population histogram showing the distribution of significant rate peaks (blue) and rate minima (red) as a function of syllable timing (35 syllables from 9 type-4 neurons). Note that significant modulations occur throughout the syllables.
Fig. 7.
Fig. 7.
Distinct bursting behavior in different cell types. A: population-average ISI distributions (mean ± SE) are distinct for all neuronal types. Color code as in Fig. 1. Note the 2 peaks exhibited by type-1 neurons: the peak at short intervals resulting from bursts, and the peak at long intervals resulting from their sparse firing. B: population-average spike train autocorrelations (mean ± SE) for type-1 neurons. Right: expanded view of the peak at short times. C: population-average spike train autocorrelations (mean ± SE) for type-2-4 neurons. Note the different vertical scale. Right: expanded view of the peaks at short times. Note the relatively long refractory period of type-3 neurons. D: for each type-2, -3 and -4 neuron, the coefficient of variation of the ISI distribution (CVISI) is plotted against the fraction of all spikes that are contained within a burst. E: CV vs. the average number of spikes per burst. Left: population histogram of CVISI; bottom: population histograms for data in D and E. Color code as in Fig. 1.
Fig. 8.
Fig. 8.
Singing-related activity of 20 area X neurons recorded during a single syllable in a single bird, aged 51–55 dph. Each row in the raster shows the singing-related spikes during 1 rendition of the syllable. Alternating red and blue colors indicate different area X neurons with the hypothesized subtype indicated at right. Neurons type 1–4 are, respectively, putative medium spiny neurons, fast spikers, TANs, and low-threshold spikers.

Similar articles

Cited by

References

    1. Andalman AS, Fee MS. A basal ganglia-forebrain circuit in the songbird biases motor output to avoid vocal errors. Proc Natl Acad Sci USA 106: 12518–12523, 2009 - PMC - PubMed
    1. Aosaki T, Kimura M, Graybiel AM. Temporal and spatial characteristics of tonically active neurons of the primate's striatum. J Neurophysiol 73: 1234–1252, 1995 - PubMed
    1. Aosaki T, Tsubokawa H, Ishida A, Watanabe K, Graybiel AM, Kimura M. Responses of tonically active neurons in the primate's striatum undergo systematic changes during behavioral sensorimotor conditioning. J Neurosci 14: 3969–3984, 1994 - PMC - PubMed
    1. Apicella P. Leading tonically active neurons of the striatum from reward detection to context recognition. Trends Neurosci 30: 299–306, 2007 - PubMed
    1. Apicella P, Scarnati E, Schultz W. Tonically discharging neurons of monkey striatum respond to preparatory and rewarding stimuli. Exp Brain Res 84: 672–675, 1991 - PubMed

Publication types

LinkOut - more resources