

Response latency to lingual taste stimulation distinguishes neuron types within the geniculate ganglion
- PMID: 20107132
- PMCID: PMC2853290
- DOI: 10.1152/jn.00785.2009
Response latency to lingual taste stimulation distinguishes neuron types within the geniculate ganglion
Abstract
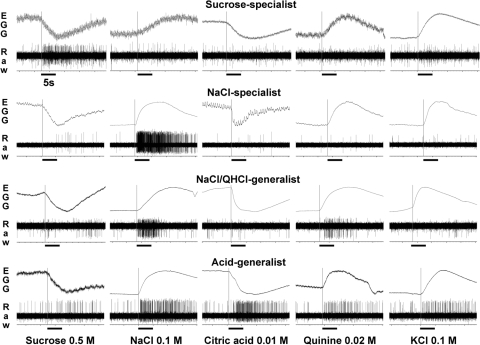
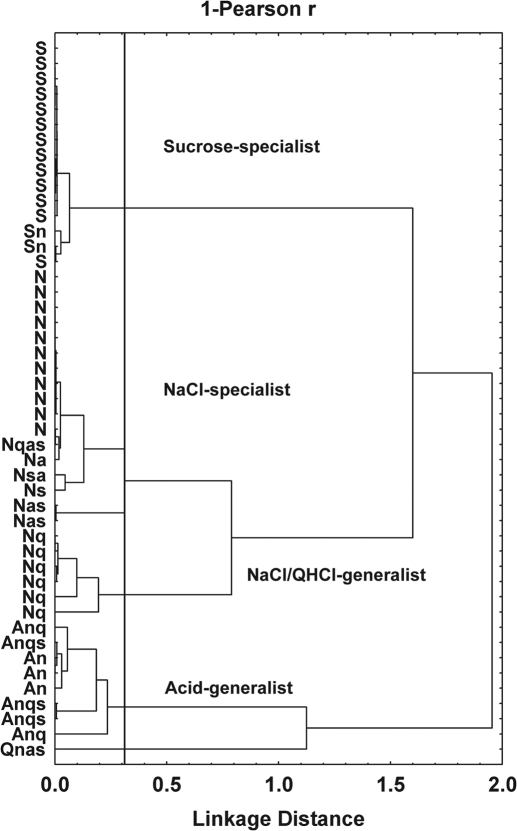
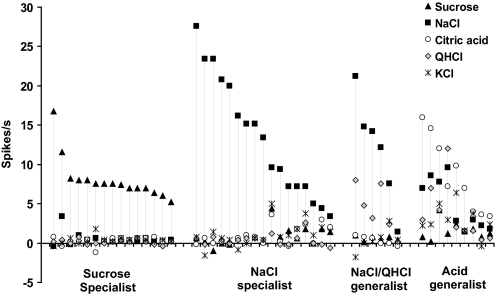
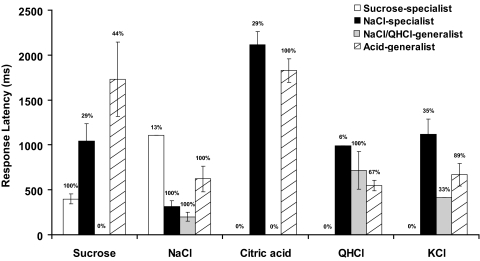
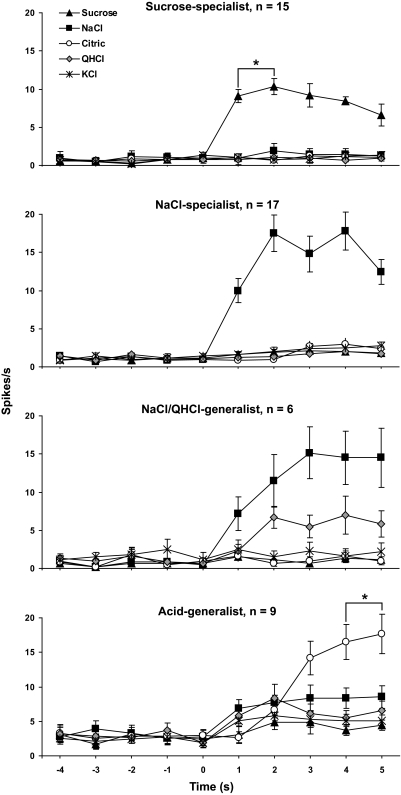
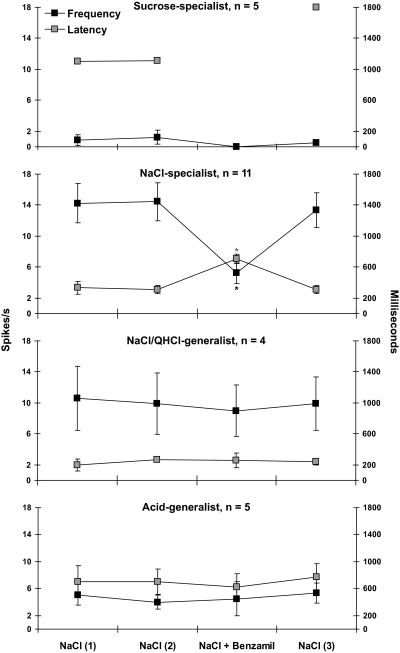
The purpose of this study was to investigate the role of response latency in discrimination of chemical stimuli by geniculate ganglion neurons in the rat. Accordingly, we recorded single-cell 5-s responses from geniculate ganglion neurons (n = 47) simultaneously with stimulus-evoked summated potentials (electrogustogram; EGG) from the anterior tongue to signal when the stimulus contacted the lingual epithelium. Artificial saliva served as the rinse solution and solvent for all stimuli [(0.5 M sucrose, 0.03-0.5 M NaCl, 0.01 M citric acid, and 0.02 M quinine hydrochloride (QHCl)], 0.1 M KCl as well as for 0.1 M NaCl +1 μM benzamil. Cluster analysis separated neurons into four groups (sucrose specialists, NaCl specialists, NaCl/QHCl generalists and acid generalists). Artificial saliva elevated spontaneous firing rate and response frequency of all neurons. As a rule, geniculate ganglion neurons responded with the highest frequency and shortest latency to their best stimulus with acid generalist the only exception. For specialist neurons and NaCl/QHCl generalists, the average response latency to the best stimulus was two to four times shorter than the latency to secondary stimuli. For NaCl-specialist neurons, response frequency increased and response latency decreased systematically with increasing NaCl concentration; benzamil significantly decreased NaCl response frequency and increased response latency. Acid-generalist neurons had the highest spontaneous firing rate and were the only group that responded consistently to citric acid and KCl. For many acid generalists, a citric-acid-evoked inhibition preceded robust excitation. We conclude that response latency may be an informative coding signal for peripheral chemosensory neurons.
Figures
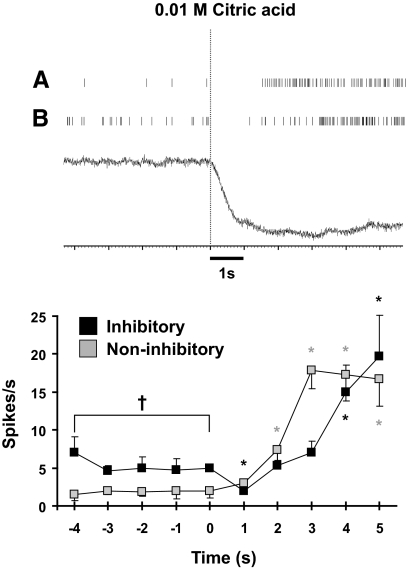
 , n = 6) acid-generalist neurons to stimulation with 0.01 M citric acid for 5 s. ∗ and gray star, within group significance (P < 0.05), corresponding to inhibitory and noninhibitory acid generalists, respectively. †, between group significance (P < 0.05).
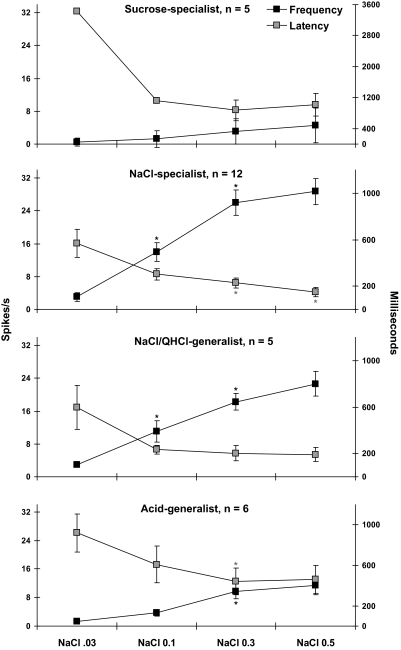
Similar articles
-
Acetic acid modulates spike rate and spike latency to salt in peripheral gustatory neurons of rats.J Neurophysiol. 2012 Nov;108(9):2405-18. doi: 10.1152/jn.00114.2012. Epub 2012 Aug 15. J Neurophysiol. 2012. PMID: 22896718 Free PMC article.
-
Gustatory neuron types in rat geniculate ganglion.J Neurophysiol. 1999 Dec;82(6):2970-88. doi: 10.1152/jn.1999.82.6.2970. J Neurophysiol. 1999. PMID: 10601433
-
Anion size modulates salt taste in rats.J Neurophysiol. 2012 Mar;107(6):1632-48. doi: 10.1152/jn.00621.2011. Epub 2011 Dec 28. J Neurophysiol. 2012. PMID: 22205652 Free PMC article.
-
Temperature modulates taste responsiveness and stimulates gustatory neurons in the rat geniculate ganglion.J Neurophysiol. 2006 Feb;95(2):674-85. doi: 10.1152/jn.00793.2005. Epub 2005 Nov 2. J Neurophysiol. 2006. PMID: 16267112
-
Cracking taste codes by tapping into sensory neuron impulse traffic.Prog Neurobiol. 2008 Nov;86(3):245-63. doi: 10.1016/j.pneurobio.2008.09.003. Epub 2008 Sep 7. Prog Neurobiol. 2008. PMID: 18824076 Free PMC article. Review.
Cited by
-
Statistical analysis and decoding of neural activity in the rodent geniculate ganglion using a metric-based inference system.PLoS One. 2013 May 30;8(5):e65439. doi: 10.1371/journal.pone.0065439. Print 2013. PLoS One. 2013. PMID: 23738016 Free PMC article.
-
The Neural Code for Taste in the Nucleus of the Solitary Tract of Rats with Obesity Following Roux-En-Y Gastric Bypass Surgery.Nutrients. 2022 Oct 4;14(19):4129. doi: 10.3390/nu14194129. Nutrients. 2022. PMID: 36235781 Free PMC article.
-
Optogenetic Stimulation of Type I GAD65+ Cells in Taste Buds Activates Gustatory Neurons and Drives Appetitive Licking Behavior in Sodium-Depleted Mice.J Neurosci. 2020 Oct 7;40(41):7795-7810. doi: 10.1523/JNEUROSCI.0597-20.2020. Epub 2020 Sep 2. J Neurosci. 2020. PMID: 32878902 Free PMC article.
-
The neuroscience of sugars in taste, gut-reward, feeding circuits, and obesity.Cell Mol Life Sci. 2020 Sep;77(18):3469-3502. doi: 10.1007/s00018-020-03458-2. Epub 2020 Jan 31. Cell Mol Life Sci. 2020. PMID: 32006052 Free PMC article. Review.
-
Acetic acid modulates spike rate and spike latency to salt in peripheral gustatory neurons of rats.J Neurophysiol. 2012 Nov;108(9):2405-18. doi: 10.1152/jn.00114.2012. Epub 2012 Aug 15. J Neurophysiol. 2012. PMID: 22896718 Free PMC article.
References
-
- Boudreau JC. Rat neurophysiological taste responses to salt solutions. Chem Senses 8: 131–150, 1983
-
- Breza JM, Curtis KS, Contreras RJ. Temperature modulates taste responsiveness and stimulates gustatory neurons in the rat geniculate ganglion. J Neurophysiol 95: 674–685, 2006 - PubMed
-
- Breza JM, Curtis KS, Contreras RJ. Monosodium glutamate but not linoleic acid differentially activates gustatory neurons in the rat geniculate ganglion. Chem Senses 32: 833–846, 2007 - PubMed
-
- Chandrashekar J, Hoon MA, Ryba NJ, Zuker CS. The receptors and cells for mammalian taste. Nature 444: 288–294, 2006 - PubMed
Publication types
MeSH terms
Substances
Grants and funding
LinkOut - more resources
Full Text Sources
Other Literature Sources
Research Materials