

Spinal cord repair in MS: does mitochondrial metabolism play a role?
- PMID: 20107138
- PMCID: PMC2939018
- DOI: 10.1212/WNL.0b013e3181d26968
Spinal cord repair in MS: does mitochondrial metabolism play a role?
Abstract
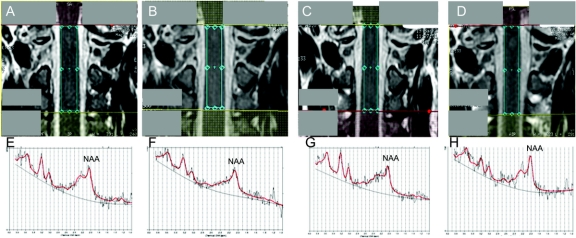
Objective: To investigate the mechanisms of spinal cord repair and their relative contribution to clinical recovery in patients with multiple sclerosis (MS) after a cervical cord relapse, using spinal cord (1)H-magnetic resonance spectroscopy (MRS) and volumetric imaging.
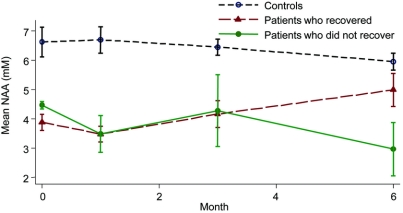
Methods: Fourteen patients with MS and 13 controls underwent spinal cord imaging at baseline and at 1, 3, and 6 months. N-acetyl-aspartate (NAA) concentration, which reflects axonal count and metabolism in mitochondria, and the cord cross-sectional area, which indicates axonal count, were measured in the affected cervical region. Mixed effect linear regression models investigated the temporal evolution of these measures and their association with clinical changes. Ordinal logistic regressions identified predictors of recovery.
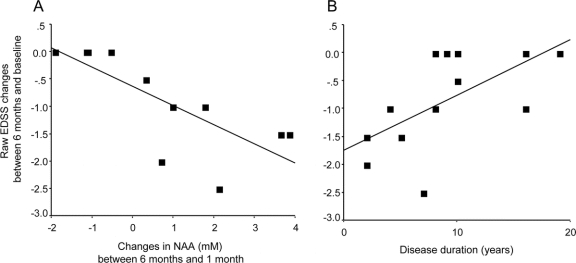
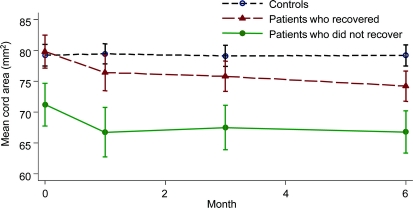
Results: Patients who recovered showed a sustained increase in NAA after 1 month. In the whole patient group, a greater increase of NAA after 1 month was associated with greater recovery. Patients showed a significant decline in cord area during follow-up, which did not correlate with clinical changes. A worse recovery was predicted by a longer disease duration at study entry.
Conclusions: The partial recovery of N-acetyl-aspartate levels after the acute event, which is concurrent with a decline in cord cross-sectional area, may be driven by increased axonal mitochondrial metabolism. This possible repair mechanism is associated with clinical recovery, and is less efficient in patients with longer disease duration. These insights into the mechanisms of spinal cord repair highlight the need to extend spinal cord magnetic resonance spectroscopy to other spinal cord disorders, and explore therapies that enhance recovery by modulating mitochondrial activity.
Figures
Comment in
-
The brake on neurodegeneration: Increased mitochondrial metabolism in the injured MS spinal cord.Neurology. 2010 Mar 2;74(9):710-1. doi: 10.1212/WNL.0b013e3181d1cd76. Epub 2010 Jan 27. Neurology. 2010. PMID: 20107139 No abstract available.
References
-
- Barkhof F, Calabresi PA, Miller DH, Reingold SC. Imaging outcomes for neuroprotection and repair in multiple sclerosis trials. Nat Rev Neurol 2009;5:256–266. - PubMed
-
- Ciccarelli O, Wheeler-Kingshott CA, McLean MA, et al. Spinal cord spectroscopy and diffusion-based tractography to assess acute disability in multiple sclerosis. Brain 2007;130(pt 8):2220–2231. - PubMed
-
- Miller DH, Barkhof F, Frank JA, Parker GJ, Thompson AJ. Measurement of atrophy in multiple sclerosis: pathological basis, methodological aspects and clinical relevance. Brain 2002;125(pt 8):1676–1695. - PubMed
Publication types
MeSH terms
Substances
Grants and funding
LinkOut - more resources
Full Text Sources