. 2010 Mar;20(3):332-40.
doi: 10.1101/gr.096826.109. Epub 2010 Jan 27.

Widespread and tissue specific age-related DNA methylation changes in mice

Affiliations

Widespread and tissue specific age-related DNA methylation changes in mice

Shinji Maegawa et al. Genome Res. 2010 Mar.

Abstract

Aberrant methylation of promoter CpG islands in cancer is associated with silencing of tumor-suppressor genes, and age-dependent hypermethylation in normal appearing mucosa may be a risk factor for human colon cancer. It is not known whether this age-related DNA methylation phenomenon is specific to human tissues. We performed comprehensive DNA methylation profiling of promoter regions in aging mouse intestine using methylated CpG island amplification in combination with microarray analysis. By comparing C57BL/6 mice at 3-mo-old versus 35-mo-old for 3627 detectable autosomal genes, we found 774 (21%) that showed increased methylation and 466 (13%) that showed decreased methylation. We used pyrosequencing to quantitatively validate the microarray data and confirmed linear age-related methylation changes for all 12 genomic regions examined. We then examined 11 changed genomic loci for age-related methylation in other tissues. Of these, three of 11 showed similar changes in lung, seven of 11 changed in liver, and six of 11 changed in spleen, though to a lower degree than the changes seen in colon. There was partial conservation between age-related hypermethylation in human and mouse intestines, and Polycomb targets in embryonic stem cells were enriched among the hypermethylated genes. Our findings demonstrate a surprisingly high rate of hyper- and hypomethylation as a function of age in normal mouse small intestine tissues and a strong tissue-specificity to the process. We conclude that epigenetic deregulation is a common feature of aging in mammals.


Figures
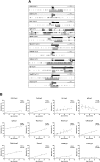
Figure 1.
Figure 1.
Methylation profiles by pyrosequencing analysis. (A) Gene structure and CpG sites analyzed. Maps represent 3.5 kb of sequence around CpG islands (hatched boxes) and exons (black boxes) of genes analyzed in this study. Short vertical bars represent CpG sites. Arrows point to transcriptional start sites. Gray boxes represent amplified regions for pyrosequencing (py). (B) Association of the percentages of methylated cytosines in the samples as obtained from pyrosequencing (y-axis) with age (x-axis) for 12 genes. The Spearman test was used to determine correlations, with significance set at P < 0.05. R represents a measure of the linear relationship between two variables, and varies from −1 to +1.
Figure 2.
Figure 2.
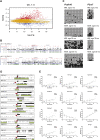
MCAM analysis of age-related methylation. (A) R–I plot of the significant probes with FDR at 5% and fold change greater than two for MCAM. An R–I plot displays the log2(R/G) ratio for each element on the array as a function of the log10(R × G) product intensities and can reveal systematic intensity-dependent effects in the measured log2 (ratio) values. The red and blue spots indicate probes hypermethylated and hypomethylated in aged small intestine, respectively. (B) Chromosomal regions of age-related methylation. (Black vertical bars) Detectable regions by MCAM (DNA fragments < 2 kb); (blue vertical bars) regions showing hypomethylation with age (ratio < 2.0); (red vertical bars) regions showing hypermethylation with age (ratio > 2.0). (C) Bisulfite sequencing analysis in small intestine. Methylation profiles of Pcdh10 and P2rx7 in young and old small intestines. Each circle represents an individual CpG dinucleotide. (Filled circles) Methylated CpG; (open circles) unmethylated CpG; (gray circles) incomplete sequence. Orders of CpGs follow the direction of genomic DNA sequence shown in Fig. 1A. The drawing is not to scale. Each block of lines represents methylation data from sequencing of cloned PCR products. Each single line indicates the methylation profile detected by direct sequencing analysis from one clone. Horizontal bars represent the CpG sites used for pyrosequencing analysis. (D) Gene structure and CpG sites analyzed. Maps represent 3.5 kb of sequence around CpG islands (green boxes) and exons (black boxes) of genes analyzed in this study. Short vertical bars represent CpG sites. Arrows point to transcriptional start sites. Red boxes represent amplified regions for pyrosequencing. (E) Association of the percentages of methylated cytosines in the samples as obtained from pyrosequencing (y-axis) with age (x-axis) for 12 genes. The Spearman test was used to determine correlations, with significance set at P < 0.05. R represents a measure of the linear relationship between two variables, and varies from −1 to +1.
Figure 3.
Figure 3.
Tissue specificity of age-related methylation. Comparison of methylation changes in small intestine, lung, kidney, liver, and spleen tissues with age. Each dot corresponds to one animal, grouped into young (Y, <12 mo) and old (O, >12 mo).
Figure 4.
Figure 4.
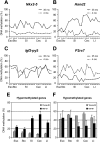
Methylation profiles of young and aged gastrointestinal tract (esophagus, stomach, small intestine, cecum, and large intestine). (A–D) Methylation profiles of Nkx2-5, Hand2, Igf2-py5, and P2rx7, respectively. (X-axis) The percentage of methylation; (y-axis) regions analyzed in the GI tract from esophagus to large intestine; (dotted lines) young tissues (3 mo); (solid lines) aged tissues (35 mo). (E) Methylation profiles of hypermethylated genes with age. Average percentages of methylation of Hand2, Pgr, Nptx2, Prdm5, and Dok5. (F) Methylation profiles of hypomethylated genes with age. Average percentages of methylation of P2rx7 and Igf2-py5.
Figure 5.
Figure 5.
Age-related changes in mRNA expression in large intestine. Expression was measured for four genes showing age-related hypermethylation (Gpr37, Hoxa11, Pcdh10, and Prdm5), one showing age-related hypomethylation (P2rx7) and two (Tmp2 and Cpe) showing unchanged methylation with age. The expression data for each gene was Z-score transformed, and we averaged values for hyper/hypo/unchanged methylation. Black and gray solid bars represent the expression level of hypermethylated and hypomethylated genes with age. (Y) Young tissues; (O) old tissues. Bars represent standard error. *P < 0.05

Similar articles

Cited by

References

    1. Ahuja N, Issa JP. Aging, methylation and cancer. Histol Histopathol. 2000;15:835–842. - PubMed
    1. Ahuja N, Li Q, Mohan AL, Baylin SB, Issa JP. Aging and DNA methylation in colorectal mucosa and cancer. Cancer Res. 1998;58:5489–5494. - PubMed
    1. Antequera F, Bird A. Number of CpG islands and genes in human and mouse. Proc Natl Acad Sci. 1993;90:11995–11999. - PMC - PubMed
    1. Bird AP. CpG-rich islands and the function of DNA methylation. Nature. 1986;321:209–213. - PubMed
    1. Boyer LA, Plath K, Zeitlinger J, Brambrink T, Medeiros LA, Lee TI, Levine SS, Wernig M, Tajonar A, Ray MK, et al. Polycomb complexes repress developmental regulators in murine embryonic stem cells. Nature. 2006;441:349–353. - PubMed

Publication types