Measurement of the time course of optical quality and visual deterioration during tear break-up
- PMID: 20107168
- PMCID: PMC3990466
- DOI: 10.1167/iovs.09-4831
Measurement of the time course of optical quality and visual deterioration during tear break-up
Abstract
Purpose: To compare changes in optical quality and visual performance that accompany tear break-up (TBU) during blink suppression.
Methods: A three-channel optical system was developed that simultaneously measured refractive aberrations (Shack-Hartmann aberrometer), 20/40 letter contrast sensitivity (CS), and TBU (retroillumination, RI). Ten wearers of silicone hydrogel contact lenses were asked to keep one eye open for approximately 18 seconds, while CS, wavefront aberrations, and RI images were collected. The wavefront was reconstructed by zonal methods, and image quality was quantified with a series of metrics including RMS fit error. Novel metrics for quantifying TBU over the contact lens surface were developed by quantifying the contrast of the RI image and by using Fourier descriptors of the first Purkinje (PJ) image shape.
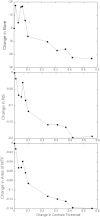
Results: There was a full range of TBU over the lens surface, with four subjects showing TBU across the corneal center and one subject with TBU in the inferior peripheral pupil. Among the four subjects with central corneal TBU, RMS fit error, RI contrast, and PJ Fourier descriptors showed high correlation with CS (r(2) range, 0.9187-0.9414, 0.6261-0.975, and 0.4917-0.8986, respectively). Some of the general optical-quality metrics such as blur strength, neural sharpness, and area of modulation transfer function (MTF) also showed that change correlated with CS loss.
Conclusions: Optical metrics of tear quality and retinal image quality are associated with the decline in vision that occurs with TBU. The evidence supports the hypothesis that blurry vision symptoms reported by contact lens wearers are caused by poor quality of the retinal image due to TBU.
Figures


Similar articles
-
Scale and spatial distribution of aberrations associated with tear breakup.Optom Vis Sci. 2012 Nov;89(11):1590-600. doi: 10.1097/OPX.0b013e31826cfae5. Optom Vis Sci. 2012. PMID: 23080060 Free PMC article.
-
Optical and visual impact of tear break-up in human eyes.Invest Ophthalmol Vis Sci. 2000 Dec;41(13):4117-23. Invest Ophthalmol Vis Sci. 2000. PMID: 11095604
-
Optical quality and visual performance with customised soft contact lenses for keratoconus.Ophthalmic Physiol Opt. 2014 Sep;34(5):528-39. doi: 10.1111/opo.12133. Epub 2014 Apr 24. Ophthalmic Physiol Opt. 2014. PMID: 24758229
-
Wave aberration of human eyes and new descriptors of image optical quality and visual performance.J Cataract Refract Surg. 2010 Feb;36(2):313-31. doi: 10.1016/j.jcrs.2009.09.026. J Cataract Refract Surg. 2010. PMID: 20152616 Review.
-
[Quantitative assessment of quality of vision].Nippon Ganka Gakkai Zasshi. 2004 Dec;108(12):770-807; discussion 808. Nippon Ganka Gakkai Zasshi. 2004. PMID: 15656087 Review. Japanese.
Cited by
-
Comparison of the impact of nesofilcon A hydrogel contact lens on the ocular surface and the comfort of presbyopic and non-presbyopic wearers.Int J Ophthalmol. 2019 Apr 18;12(4):640-646. doi: 10.18240/ijo.2019.04.19. eCollection 2019. Int J Ophthalmol. 2019. PMID: 31024820 Free PMC article.
-
The Effects of Increasing Ocular Surface Stimulation on Blinking and Tear Secretion.Invest Ophthalmol Vis Sci. 2015 Jul;56(8):4211-20. doi: 10.1167/iovs.14-16313. Invest Ophthalmol Vis Sci. 2015. PMID: 26132780 Free PMC article.
-
Review of hydroxypropyl cellulose ophthalmic inserts for treatment of dry eye.Clin Ophthalmol. 2011;5:587-91. doi: 10.2147/OPTH.S13889. Epub 2011 May 11. Clin Ophthalmol. 2011. PMID: 21654886 Free PMC article.
-
Fourier-Domain OCT Imaging of the Ocular Surface and Tear Film Dynamics: A Review of the State of the Art and an Integrative Model of the Tear Behavior During the Inter-Blink Period and Visual Fixation.J Clin Med. 2020 Mar 2;9(3):668. doi: 10.3390/jcm9030668. J Clin Med. 2020. PMID: 32131486 Free PMC article. Review.
-
A Randomized Multicenter Study Comparing 0.1%, 0.15%, and 0.3% Sodium Hyaluronate with 0.05% Cyclosporine in the Treatment of Dry Eye.J Ocul Pharmacol Ther. 2017 Mar;33(2):66-72. doi: 10.1089/jop.2016.0086. Epub 2016 Dec 8. J Ocul Pharmacol Ther. 2017. PMID: 27929721 Free PMC article. Clinical Trial.
References
-
- Nichols KK, Begley CG, Caffery B, Jones LA. Symptoms of ocular irritation in patients diagnosed with dry eye. Optom Vis Sci. 1999;76:838–844 - PubMed
-
- Begley CG, Chalmers RL, Mitchell GL, et al. Characterization of ocular surface symptoms from optometric practices in North America. Cornea. 2001;20:610–618 - PubMed
-
- Johnson ME, Murphy PJ. Measurement of ocular surface irritation on a linear interval scale with the ocular comfort index. Invest Ophthalmol Vis Sci. 2007;48:4451–4458 - PubMed
-
- Sade de Paiva C, Lindsey JL, Pflugfelder SC. Assessing the severity of keratitis sicca with videokeratoscopic indices. Ophthalmology. 2003;110:1102–1109 - PubMed
Publication types
MeSH terms
LinkOut - more resources
Full Text Sources
Other Literature Sources
Medical
Miscellaneous

