

Adiposity is inversely related to insulin sensitivity in relatively lean Chinese adolescents: a population-based twin study
- PMID: 20107193
- PMCID: PMC2823638
- DOI: 10.3945/ajcn.2009.28750
Adiposity is inversely related to insulin sensitivity in relatively lean Chinese adolescents: a population-based twin study
Abstract
Background: Adolescence is a critical period for rising adiposity and falling insulin sensitivity (IS), but the independent relation between adiposity and IS remains understudied.
Objective: The objective was to examine which adiposity measures are most strongly associated with IS in nondiabetic adolescents, whether sex-difference exists, and to what degree genetic or environmental factors affect the adiposity-IS relation.
Design: The study included 1613 rural Chinese adolescents (888 males) aged 13-20 y from a population-based twin cohort. We used graphic plots and linear mixed models to examine the relation of anthropometric and dual-energy X-ray absorptiometry-based measures of adiposity with IS [QUantitative Insulin-sensitivity ChecK Index (QUICKI), fasting serum insulin (FSI), homeostasis model assessment of insulin resistance (HOMA-IR)] and structural equation models to estimate genetic/environmental influences on these associations.
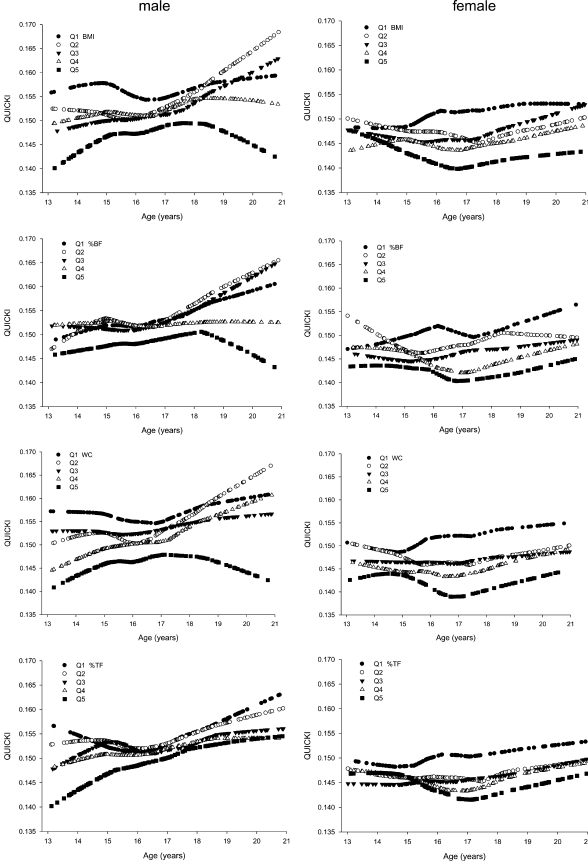
Results: In graphic analyses, participants in the highest quintile (quintile 5) of waist circumference (WC) and percentage body fat (%BF) had the lowest QUICKI and the highest FSI and HOMA-IR values for all age-sex groups. In regression models adjusted for age, Tanner stage, zygosity, and physical activity, all adiposity measures showed inverse associations with IS in both sexes, but WC explained the largest fraction of variance in IS measures (10-14%). Of the phenotypic correlations between adiposity measures and IS (-0.28 to -0.38), 74-85% were attributed to shared genetic factors and 15-26% to common unique environmental factors in both sexes.
Conclusions: In these relatively lean Chinese adolescents, WC and %BF (quintile 5) are the adiposity measures most consistently and strongly associated with decreased IS in both sexes. To a large degree, shared genetic factors contribute to this association.
Figures
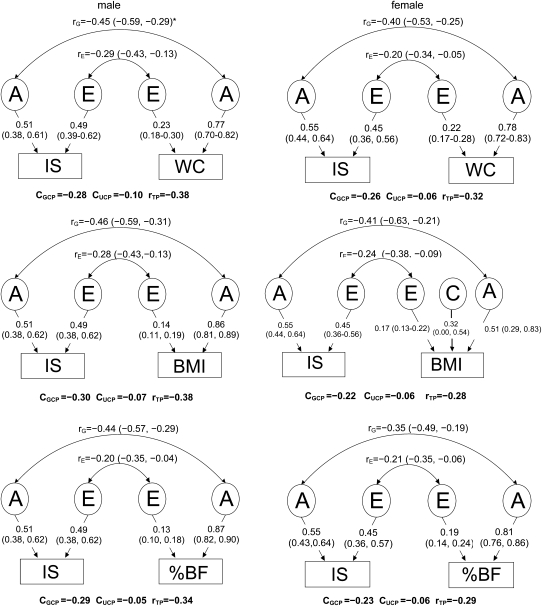
 The genetic (A), common environment (C), and individual specific environment (E) components for each phenotype were similar to those from univariate genetic models, but they were not identical because bivariate analysis included covariance between the 2 variables examined.
Similar articles
-
Associations of Body Composition Measurements with Serum Lipid, Glucose and Insulin Profile: A Chinese Twin Study.PLoS One. 2015 Nov 10;10(11):e0140595. doi: 10.1371/journal.pone.0140595. eCollection 2015. PLoS One. 2015. PMID: 26556598 Free PMC article.
-
Association of adiposity trajectories with insulin sensitivity and glycemic deterioration: a longitudinal study of rural Chinese twin adults.Diabetes Care. 2012 Jul;35(7):1506-12. doi: 10.2337/dc11-2060. Epub 2012 May 17. Diabetes Care. 2012. PMID: 22596174 Free PMC article.
-
Association between dietary fat intake and insulin resistance in Chinese child twins.Br J Nutr. 2017 Jan;117(2):230-236. doi: 10.1017/S0007114516004542. Epub 2017 Jan 25. Br J Nutr. 2017. PMID: 28120734
-
Adiposity mediates the association between whole grain consumption, glucose homeostasis and insulin resistance: findings from the US NHANES.Lipids Health Dis. 2018 Sep 17;17(1):219. doi: 10.1186/s12944-018-0805-6. Lipids Health Dis. 2018. PMID: 30223829 Free PMC article.
-
Association between insulin-like growth factor-1, measures of overnutrition and undernutrition and insulin resistance in black adolescents living in the North-West Province, South Africa.Am J Hum Biol. 2014 Mar-Apr;26(2):189-97. doi: 10.1002/ajhb.22498. Epub 2013 Dec 26. Am J Hum Biol. 2014. PMID: 24375890
Cited by
-
The Relationship between Fat Mass Percentage and Glucose Metabolism in Children and Adolescents: A Systematic Review and Meta-Analysis.Nutrients. 2022 May 28;14(11):2272. doi: 10.3390/nu14112272. Nutrients. 2022. PMID: 35684072 Free PMC article.
-
Body mass index, waist circumference, body fat, fasting blood glucose in a sample of moroccan adolescents aged 11-17 years.J Nutr Metab. 2012;2012:510458. doi: 10.1155/2012/510458. Epub 2011 Nov 28. J Nutr Metab. 2012. PMID: 22175010 Free PMC article.
-
Distribution and determinants of plasma homocysteine levels in rural Chinese twins across the lifespan.Nutrients. 2014 Dec 18;6(12):5900-14. doi: 10.3390/nu6125900. Nutrients. 2014. PMID: 25529062 Free PMC article.
-
Childhood BMI and Fasting Glucose and Insulin Predict Adult Type 2 Diabetes: The International Childhood Cardiovascular Cohort (i3C) Consortium.Diabetes Care. 2020 Nov;43(11):2821-2829. doi: 10.2337/dc20-0822. Epub 2020 Sep 1. Diabetes Care. 2020. PMID: 32873588 Free PMC article.
-
Effects of rosuvastatin on metabolic profile: Versatility of dose-dependent effect.J Adv Pharm Technol Res. 2019 Jan-Mar;10(1):33-38. doi: 10.4103/japtr.JAPTR_330_18. J Adv Pharm Technol Res. 2019. PMID: 30815386 Free PMC article.
References
-
- Ebbeling CB, Pawlak DB, Ludwig DS. Childhood obesity: public-health crisis, common sense cure. Lancet 2002;360:473–82 - PubMed
-
- MacKay AP, Duran C. Adolescent health in the United States, 2007. Atlanta, GA: National Center for Health Statistics, 2007
-
- Fagot-Campagna A, Pettitt DJ, Engelgau MM, et al. Type 2 diabetes among North American children and adolescents: an epidemiologic review and a public health perspective. J Pediatr 2000;136:664–72 - PubMed
-
- Ji CY. The prevalence of childhood overweight/obesity and the epidemic changes in 1985-2000 for Chinese school-age children and adolescents. Obes Rev 2008;9(suppl 1):78–81 - PubMed
-
- Morrison JA, Barton BA, Biro FM, Daniels SR, Sprecher DL. Overweight, fat patterning, and cardiovascular disease risk factors in black and white boys. J Pediatr 1999;135:451–7 - PubMed
Publication types
MeSH terms
Substances
Grants and funding
LinkOut - more resources
Full Text Sources
Medical
Miscellaneous
