. 2009 Dec 24;4(12):e8458.
doi: 10.1371/journal.pone.0008458.

Dynamic regulation of genes involved in mitochondrial DNA replication and transcription during mouse brown fat cell differentiation and recruitment

Affiliations

Dynamic regulation of genes involved in mitochondrial DNA replication and transcription during mouse brown fat cell differentiation and recruitment

Maria Murholm et al. PLoS One. .

Abstract

Background: Brown adipocytes are specialised in dissipating energy through adaptive thermogenesis, whereas white adipocytes are specialised in energy storage. These essentially opposite functions are possible for two reasons relating to mitochondria, namely expression of uncoupling protein 1 (UCP1) and a remarkably higher mitochondrial abundance in brown adipocytes.

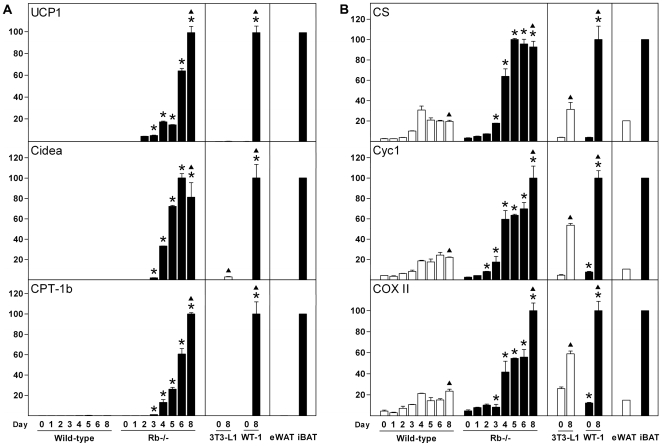
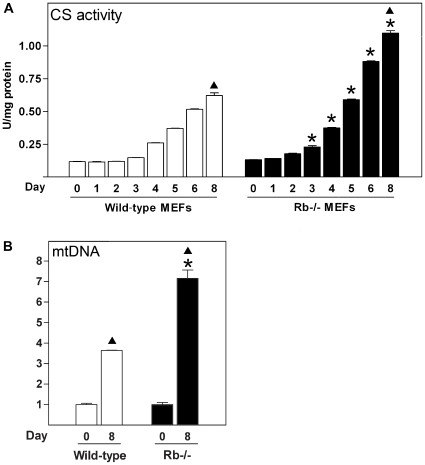
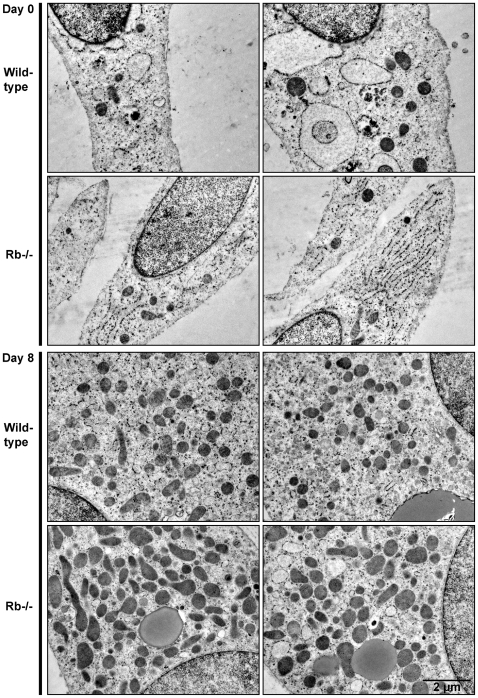
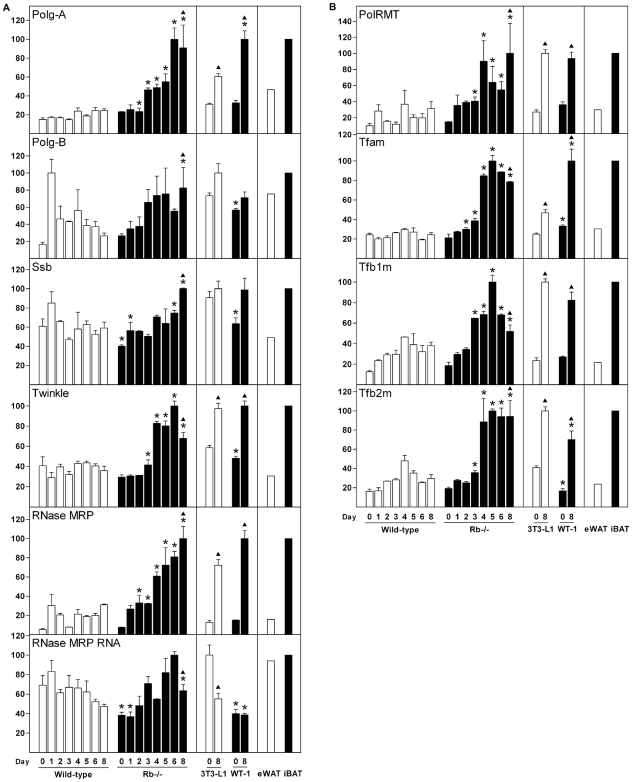
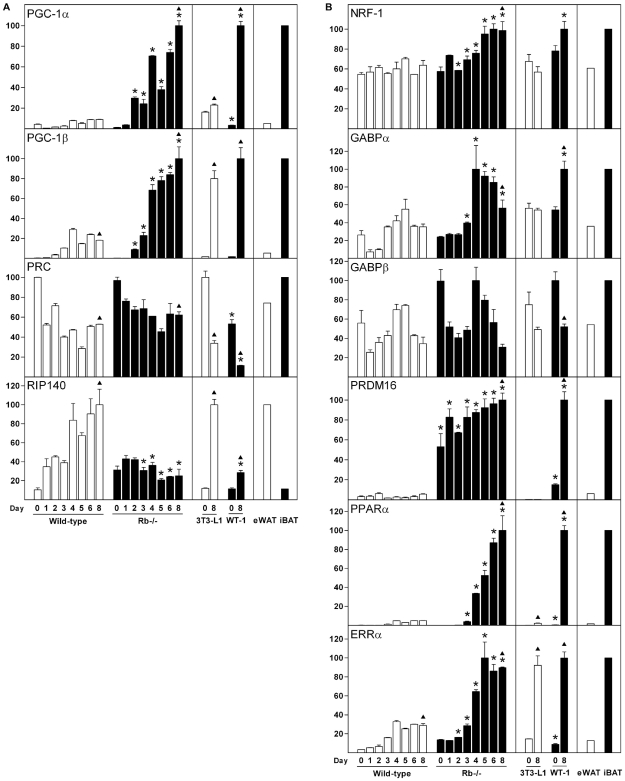
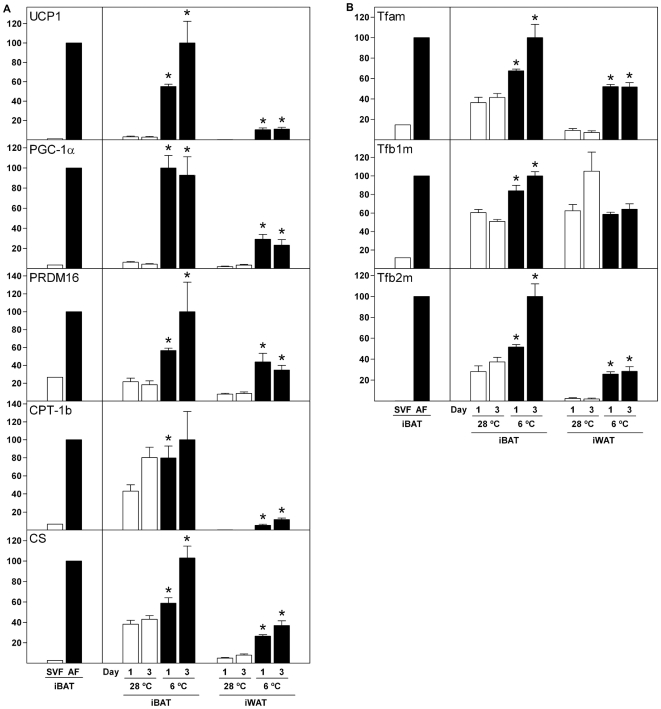
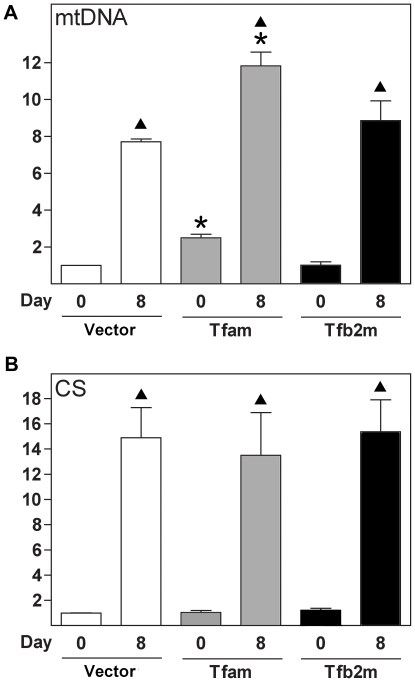
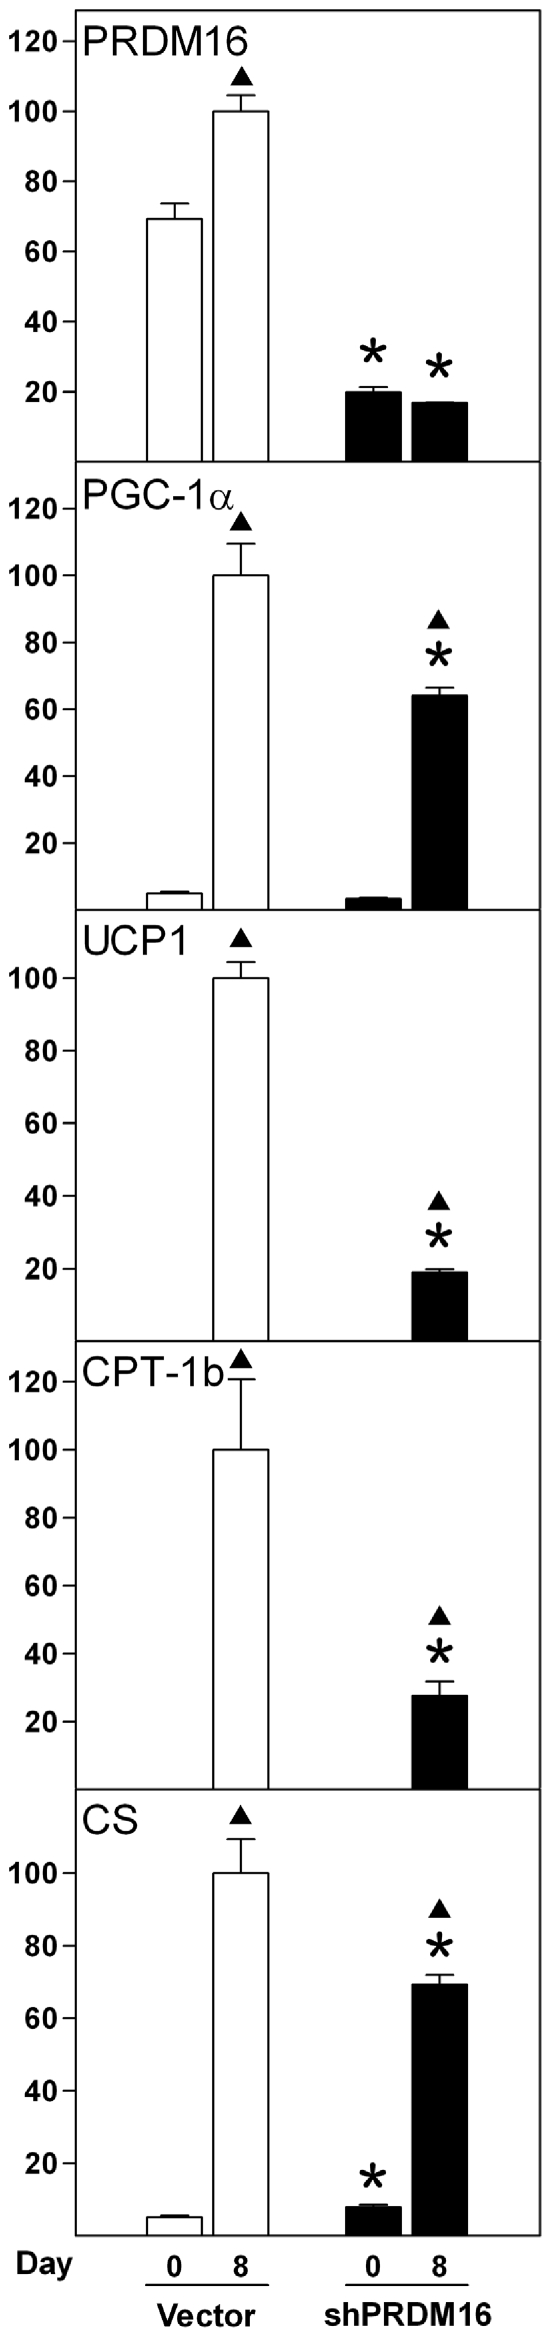
Methodology/principal findings: Here we report a comprehensive characterisation of gene expression linked to mitochondrial DNA replication, transcription and function during white and brown fat cell differentiation in vitro as well as in white and brown fat, brown adipose tissue fractions and in selected adipose tissues during cold exposure. We find a massive induction of the majority of such genes during brown adipocyte differentiation and recruitment, e.g. of the mitochondrial transcription factors A (Tfam) and B2 (Tfb2m), whereas only a subset of the same genes were induced during white adipose conversion. In addition, PR domain containing 16 (PRDM16) was found to be expressed at substantially higher levels in brown compared to white pre-adipocytes and adipocytes. We demonstrate that forced expression of Tfam but not Tfb2m in brown adipocyte precursor cells promotes mitochondrial DNA replication, and that silencing of PRDM16 expression during brown fat cell differentiation blunts mitochondrial biogenesis and expression of brown fat cell markers.

Conclusions/significance: Using both in vitro and in vivo model systems of white and brown fat cell differentiation, we report a detailed characterisation of gene expression linked to mitochondrial biogenesis and function. We find significant differences in differentiating white and brown adipocytes, which might explain the notable increase in mitochondrial content observed during brown adipose conversion. In addition, our data support a key role of PRDM16 in triggering brown adipocyte differentiation, including mitochondrial biogenesis and expression of UCP1.


Conflict of interest statement

Competing Interests: The authors have declared that no competing interests exist.

Figures

Figure 1
Figure 1. Expression of brown fat-selective genes and genes indicative of differential mitochondrial biogenesis during differentiation of white and brown adipocytes.
Cell lines were induced to differentiate as described in “Materials and Methods” and total RNA was harvested at the indicated days of differentiation. In addition, RNA from eWAT and iBAT was included. Expression levels were determined by RT-qPCR and relative expression levels of genes indicated in the figure determined by normalisation to the levels of TBP. In each of the three boxes for the individual genes, the mean of the normalized expression level of the sample with the highest value was set to 100. Error bars represent SEM. (A) Expression of the brown adipose-selective genes UCP1, Cidea and CPT-1b. (B) Gene expression pattern indicative of differential mitochondrial biogenesis. Genes measured were CS, Cyc1 and COX II. Results from one of two independent cell culture experiments are shown. *, p<0.05 [day X in wild-type MEFs (or 3T3-L1) compared to day X in Rb−/− MEFs (or WT-1)]. ▴, p<0.05 (day 0 vs. day 8 for each of the four cell lines).
Figure 2
Figure 2. Citrate synthase activity and relative mtDNA copy number during white and brown fat cell differentiation.
Cell lines were induced to differentiate as described in “Materials and Methods” and cells were harvested for measurements of enzymatic activities or relative mtDNA copy numbers at the indicated days of differentiation. Error bars represent SEM. (A) Enzyme activity of CS was determined as described in “Materials and Methods”. Enzyme activities (U) were normalised to the concentration of protein. (B) Relative mtDNA copy number was determined by qPCR using primer sets specific for mtDNA (COX II) and nDNA (RIP140), and relative mtDNA levels were calculated by normalising signals from COX II to those of RIP140. The mean of the normalized values for wild-type cells on day 0 was set to 1. A representative of three independent experiments is shown. *, p<0.05 (day X in wild-type MEFs compared to day X in Rb−/− MEFs). ▴, p<0.05 (day 0 vs. day 8 for wild-type or Rb−/− MEFs).
Figure 3
Figure 3. Transmission electron micrographs of cells before and after differentiation.
Wild-type and Rb−/− MEFs were harvested for transmission electron microscopy at days 0 and 8 of differentiation as described in “Materials and Methods”. Two representative cells of each cell line are shown at each time point. Similar results were obtained in two independent experiments.
Figure 4
Figure 4. Expression of genes involved in mtDNA replication and transcription during differentiation of white and brown adipocytes.
Cell lines were induced to differentiate as described in “Materials and Methods” and total RNA was harvested at the indicated days of differentiation. In addition, RNA from eWAT and iBAT was included. Expression levels were determined by RT-qPCR and relative expression levels of genes indicated in the figure determined by normalisation to the levels of TBP. In each of the three boxes for the individual genes, the mean of the normalized expression level of the sample with the highest value was set to 100. Error bars represent SEM. (A) Expression of genes involved in mtDNA replication. Genes measured were Polg-A, Polg-B, Ssb, Twinkle, RNase MRP and RNase MRP RNA. (B) Expression of genes involved in mitochondrial transcription. Genes measured were PolRMT, Tfam, Tfb1m and Tfb2m. Results from one of two independent cell culture experiments are shown. *, p<0.05 [day X in wild-type MEFs (or 3T3-L1) compared to day X in Rb−/− MEFs (or WT-1)]. ▴, p<0.05 (day 0 vs. day 8 for each of the four cell lines).
Figure 5
Figure 5. Expression of nuclear co-regulators and DNA-binding transcription factors linked to mitochondrial biogenesis and function during differentiation of white and brown fat cells.
Cell lines were induced to differentiate as described in “Materials and Methods” and total RNA was harvested at the indicated days of differentiation. In addition, RNA from eWAT and iBAT was included. Expression levels were determined by RT-qPCR and relative expression levels of genes indicated in the figure determined by normalisation to the levels of TBP. In each of the three boxes for the individual genes, the mean of the normalized expression level of the sample with the highest value was set to 100. Error bars represent SEM. (A) Expression of PGC-1 family members and RIP140. (B) Expression of the nuclear DNA-binding transcription factors NRF-1, GABPα, GABPβ, PRDM16, PPARα and ERRα. Results from one of two independent cell culture experiments are shown. *, p<0.05 [day X in wild-type MEFs (or 3T3-L1) compared to day X in Rb−/− MEFs (or WT-1)]. ▴, p<0.05 (day 0 vs. day 8 for each of the four cell lines).
Figure 6
Figure 6. Expression of selected genes in brown adipose tissue fractions and adipose tissues from cold-challenged mice.
RNA from BAT fractions (pool from 12 mice) and adipose tissues from cold-challenged mice (4 animals in each group) was analysed by RT-qPCR. Data for SVF and AF samples from BAT are shown in the left box, whereas data for samples from iBAT and iWAT of cold-challenged mice are shown in the right box. Expression levels in BAT fractions were normalised to the expression of 18S rRNA. Expression levels in adipose tissue from cold-challenged mice were normalised to the expression of TBP. In each of the two boxes for the individual genes, the mean of the normalized expression level of the sample with the highest value was set to 100. Error bars represent SEM. (A) Expression of UCP1, PGC-1α, PRDM16, CPT-1b and CS. (B) Expression of Tfam, Tfb1m and Tfb2m. *, p<0.05 [day X at 28°C in iBAT (or iWAT) compared to day X at 6°C in iBAT (or iWAT)].
Figure 7
Figure 7. Effect of forced expression of Tfam and Tfb2m on mtDNA replication and citrate synthase expression.
Rb−/− MEFs were transduced with an empty retrovirus (designated “Vector”) or retroviral vectors encoding Tfam or Tfb2m. Total DNA and RNA were harvested at days 0 and 8. (A) Relative mtDNA copy number was determined by qPCR using primer sets specific for mtDNA (COX II) and nDNA (RIP140) and relative mtDNA levels calculated by normalising signals from COX II to those of RIP140. (B) Expression levels were determined by RT-qPCR and the relative expression level of CS determined by normalisation to the level of TBP. The results presented are the means from three independent experiments. The Vector sample on day 0 was set to 1 in each experiment. Error bars represent SEM. *, p<0.05 (day X in Vector compared to day X in Tfam or Tfb2m). ▴, p<0.05 (day 0 vs. day 8 for Vector, Tfam or Tfb2m).
Figure 8
Figure 8. Effect of silencing of PRDM16 expression on expression levels of mitochondrial marker genes.
Rb−/− MEFs were transduced with pSUPER.retro.neo or pSUPER.retro.neo-PRDM16 virus (designated “Vector” and “shPRDM16”, respectively), selected, replated and induced to differentiate as described in “Materials and Methods” and total RNA was harvested at days 0 and 8 of differentiation. Expression levels were determined by RT-qPCR and relative expression levels of genes indicated in the figure determined by normalisation to the levels of TBP. In each of the boxes for the individual genes, the mean of the normalized expression level of the sample with the highest value was set to 100. Error bars represent SEM. Shown is the expression of PRDM16, PGC-1α, UCP1, CPT-1b and CS. A representative of three independent experiments is shown. *, p<0.05 (day X in Vector compared to day X in shPRDM16). ▴, p<0.05 (day 0 vs. day 8 for Vector or shPRDM16).

Similar articles

Cited by

References

    1. Cannon B, Nedergaard J. Brown adipose tissue: function and physiological significance. Physiol Rev. 2004;84:277–359. - PubMed
    1. Gesta S, Tseng YH, Kahn CR. Developmental origin of fat: tracking obesity to its source. Cell. 2007;131:242–256. - PubMed
    1. Hansen JB, Kristiansen K. Regulatory circuits controlling white versus brown adipocyte differentiation. Biochem J. 2006;398:153–168. - PMC - PubMed
    1. Seale P, Bjork B, Yang W, Kajimura S, Chin S, et al. PRDM16 controls a brown fat/skeletal muscle switch. Nature. 2008;454:961–967. - PMC - PubMed
    1. Timmons JA, Wennmalm K, Larsson O, Walden TB, Lassmann T, et al. Myogenic gene expression signature establishes that brown and white adipocytes originate from distinct cell lineages. Proc Natl Acad Sci USA. 2007;104:4401–4406. - PMC - PubMed

Publication types

MeSH terms